History Teachers, Postsecondary in District of Columbia
Want to work as a History Teachers, Postsecondary in District of Columbia? Here’s what you need to know. Teach courses in human history and historiography. Includes both teachers primarily engaged in teaching and those who do a combination of teaching and research.
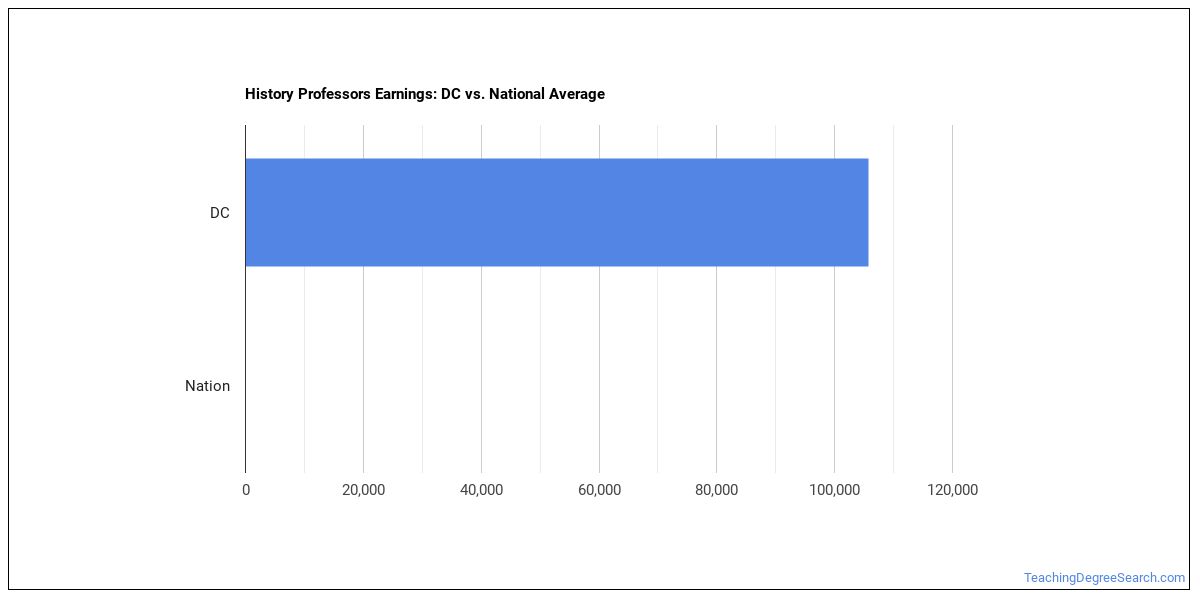
What do History Teachers, Postsecondary Make in District of Columbia?
The history teachers, postsecondary working in District of Columbia, the typical annual salary is $78,880 per year.Annual wages span from $59,150 at the 10th percentile to $127,360 at the 90th percentile.
| Wage Statistic | Annual | Hourly |
|---|---|---|
| 10th percentile | $59,150 | n/a |
| 25th percentile | $62,800 | n/a |
| Median (50th) | $78,880 | $0.00 |
| 75th percentile | $106,330 | n/a |
| 90th percentile | $127,360 | n/a |

Location quotient — how concentrated this career is in District of Columbia compared to the national average — is 1.73, indicating that history teachers, postsecondary are more concentrated here than the national average.
National Wage Comparison
Nationally, history teachers, postsecondary earn a median of $38,484 per year ($18.50/hour), exceeding the District of Columbia median.
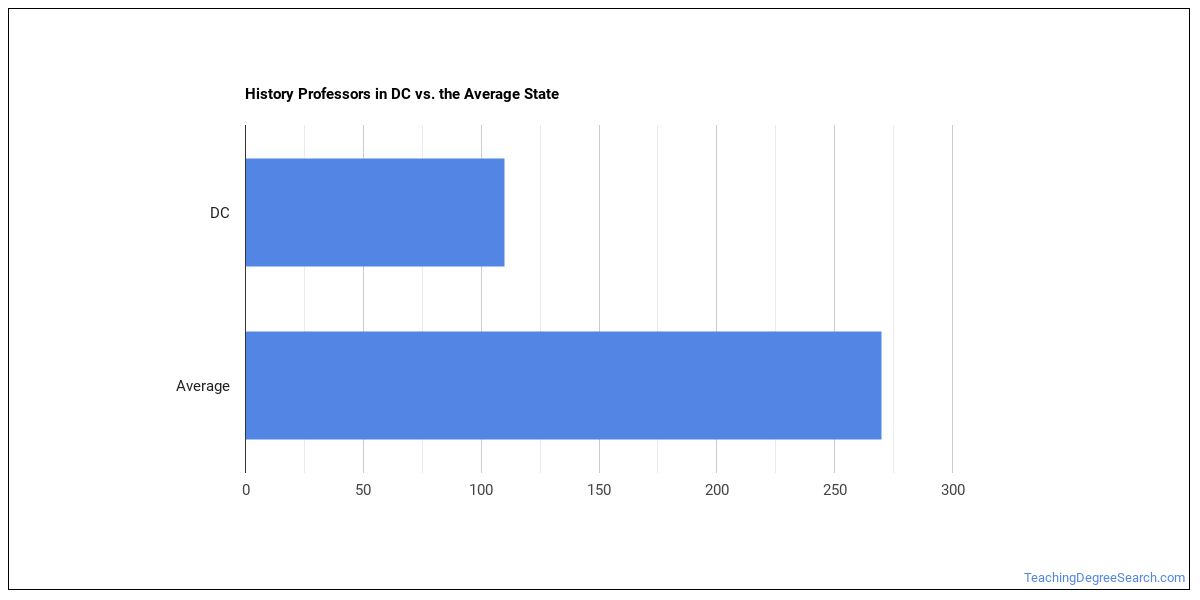
Employment Outlook
Nationally, total employment in this occupation is 1,148,630 history teachers, postsecondary in the U.S.. In District of Columbia alone, about 160 people work in this role. That’s fewer than the typical state, which employs around 280 history teachers, postsecondary.

Top District of Columbia Metros for History Teachers, Postsecondary
These are the District of Columbia metros with the most history teachers, postsecondary in District of Columbia.
| Metro Area | Number Employed | Annual Median Salary |
|---|---|---|
| Washington-Arlington-Alexandria, DC-VA-MD-WV | 420 | $91,280 |
Top States for History Teachers, Postsecondary Employment
The table below shows the states where the most history teachers, postsecondary work.
| State | Number Employed |
|---|---|
| Texas | 2,170 |
| New York | 1,780 |
| California | 1,680 |
| Pennsylvania | 890 |
| Massachusetts | 850 |
| Virginia | 810 |
| North Carolina | 790 |
| New Jersey | 640 |
| Illinois | 630 |
| Florida | 630 |
| Georgia | 620 |
| Tennessee | 530 |
| Ohio | 500 |
| Arkansas | 460 |
| Indiana | 420 |
| Alabama | 390 |
| Missouri | 390 |
| Michigan | 380 |
| Colorado | 380 |
| South Carolina | 340 |
Highest-Paying States for History Teachers, Postsecondary
Where history teachers, postsecondary earn the most: history teachers, postsecondary.
| State | Annual Median Salary |
|---|---|
| California | $121,020 |
| New Hampshire | $106,810 |
| Rhode Island | $106,240 |
| Arizona | $101,510 |
| New York | $101,180 |
| Massachusetts | $100,780 |
| New Jersey | $100,320 |
| Connecticut | $100,220 |
| Oregon | $97,680 |
| Montana | $92,550 |
Skills
The most important history teachers, postsecondary skills, rated on an importance scale of 0 to 5:
Knowledge Areas
Key knowledge areas for this occupation, rated on an importance scale of 0 to 5:
Abilities
Key abilities for history teachers, postsecondary, rated on an importance scale of 0 to 5:
Daily Tasks
Common tasks include:
- Prepare course materials, such as syllabi, homework assignments, and handouts.
- Prepare and deliver lectures to undergraduate or graduate students on topics such as ancient history, postwar civilizations, and the history of third-world countries.
- Initiate, facilitate, and moderate classroom discussions.
- Keep abreast of developments in the field by reading current literature, talking with colleagues, and participating in professional conferences.
- Conduct research in a particular field of knowledge and publish findings in professional journals, books, or electronic media.
- Compile, administer, and grade examinations, or assign this work to others.
- Evaluate and grade students' class work, assignments, and papers.
- Maintain student attendance records, grades, and other required records.
- Plan, evaluate, and revise curricula, course content, course materials, and methods of instruction.
- Select and obtain materials and supplies, such as textbooks.
- Maintain regularly scheduled office hours to advise and assist students.
- Review books and journal articles for potential publication.
Work Activities
- Identifying Objects, Actions, and Events
- Getting Information
- Updating and Using Relevant Knowledge
- Analyzing Data or Information
- Training and Teaching Others
- Thinking Creatively
- Documenting/Recording Information
- Interpreting the Meaning of Information for Others
- Processing Information
- Establishing and Maintaining Interpersonal Relationships
- Working with Computers
- Judging the Qualities of Objects, Services, or People
Tools & Technology
Common tools and software used in this occupation include: Hot technologies: Google Docs In-demand technologies: Learning management system LMS
What Major Will Prepare You For This Career?
Related college programs include:
- Teacher Education Subject Specific
Featured schools near , edit
Related Careers
Related occupations to history teachers, postsecondary include:
- Historians
- Anthropology and Archeology Teachers, Postsecondary
- Area, Ethnic, and Cultural Studies Teachers, Postsecondary
- Economics Teachers, Postsecondary
- Geography Teachers, Postsecondary
- Political Science Teachers, Postsecondary
Also Known As
Adjunct Art History Professor, Adjunct History Instructor, Adjunct Instructor, African History Professor, American History Professor, Art History Adjunct Professor, Art History Instructor, Assistant Professor, Associate Professor, College Faculty Member, College Professor, Economic History Teacher, Historiography Professor, Historiography Teacher, History Adjunct Instructor.
References
- U.S. Bureau of Labor Statistics, Occupational Employment and Wage Statistics — https://www.bls.gov/oes/
- O*NET Online — https://www.onetonline.org/
- BLS Employment Projections — https://www.bls.gov/emp/
- O*NET-SOC code: 25-1125.00
TeachingDegreeSearch.com provides higher-education, college and university, degree, program, career, salary, and other helpful information to students, faculty, institutions, and other internet audiences. Presented information and data are subject to change. Inclusion on this website does not imply or represent a direct relationship with the company, school, or brand. Information, though believed correct at time of publication, may not be correct, and no warranty is provided. Contact the schools to verify any information before relying on it. Financial aid may be available for those who qualify. The displayed options may include sponsored or recommended results, not necessarily based on your preferences.
© TeachingDegreeSearch.com – All Rights Reserved.