Music Education at Carthage College
If you plan to study Music Education, consider the program at Carthage College. We’ve gathered the following information to help you decide.
Carthage College is in Kenosha, WI.
In the most recent year for which we have data, 8 music education degrees were awarded at Carthage College.
Featured schools near , edit
Online Class Availability at Carthage College
Distance learning is available at Carthage College. Among 2,844 students, 0 (0%) studied exclusively online and 103 (4%) took at least some classes online.
Music Education Rankings at Carthage College
Rankings can help you compare Carthage College’s Music Education program against peer institutions.
Bachelor’s-Level Rankings
| Ranking | Scope | Rank |
|---|---|---|
| Best Schools (Quality) | Great Lakes (Region) | #None of 30 |
| Best Schools (Quality) | Nationwide | #None of 154 |
| Best Schools (Quality) | Wisconsin | #None of 4 |
| Best Value | Great Lakes (Region) | #None of 65 |
| Best Value | Nationwide | #None of 332 |
| Best Value | Wisconsin | #None of 12 |
Student Demographics & Diversity
Take a look at the composition of Music Education graduates at Carthage College, by degree type.
Looking at the program as a whole, Music Education graduates at Carthage College are 62% women (5) and 38% men (3).
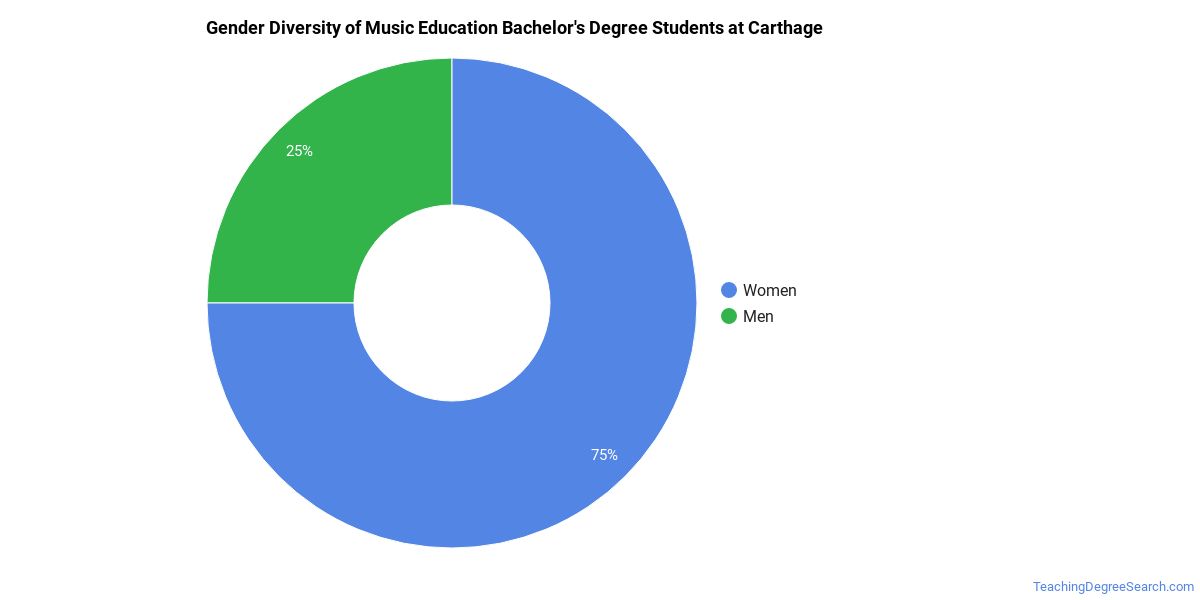
Music Education Bachelor’s Program at Carthage College
Of the 3 bachelor’s music education graduates at Carthage College, 33% were women (1) and 67% were men (2).
The following table and chart show the race/ethnicity of Music Education bachelor’s degree recipients at Carthage College.
| Race / Ethnicity | Number of Graduates |
|---|---|
| White | 2 |
| Hispanic / Latino | 1 |

Minority students account for 33% of Music Education bachelor’s degree recipients at Carthage College, higher than the national average of 23%.*
Music Education Master’s Program at Carthage College
Among the 5 master’s music education graduates at Carthage College, 80% were women (4) and 20% were men (1).

The following table and chart show the race/ethnicity of Music Education master’s degree recipients at Carthage College.
| Race / Ethnicity | Number of Graduates |
|---|---|
| Asian | 3 |
| Unknown | 2 |

Minority students account for 60% of Music Education master’s degree recipients at Carthage College, above the national average of 21%.*
*The racial-ethnic minorities figure is the total number of graduates minus White, international (nonresident), and unknown-race graduates.
Top-Paying Careers for Music Education Graduates
Those who complete Music Education program at Carthage College pursue many career paths. Below are the highest-paying careers for Music Education graduates, ordered by median annual salary:
| Occupation | Nationwide Median Wage |
|---|---|
| Education Teachers, Postsecondary | $98,329 |
| Middle School Teachers, Except Special and Career/Technical Education | $83,105 |
| Secondary School Teachers, Except Special and Career/Technical Education | $77,927 |
| Art, Drama, and Music Teachers, Postsecondary | $46,983 |
References
- IPEDS — Integrated Postsecondary Education Data System
- U.S. Department of Education — College Scorecard
- O*NET Online (Bureau of Labor Statistics)
- National Center for Education Statistics
More about our data sources and methodologies.
TeachingDegreeSearch.com provides higher-education, college and university, degree, program, career, salary, and other helpful information to students, faculty, institutions, and other internet audiences. Presented information and data are subject to change. Inclusion on this website does not imply or represent a direct relationship with the company, school, or brand. Information, though believed correct at time of publication, may not be correct, and no warranty is provided. Contact the schools to verify any information before relying on it. Financial aid may be available for those who qualify. The displayed options may include sponsored or recommended results, not necessarily based on your preferences.
© TeachingDegreeSearch.com – All Rights Reserved.