Music Education at Chapman University
If you are interested in studying Music Education, you may want to check out the program at Chapman University. The following information will help you decide if it is a good fit for you.
Chapman University is located in Orange, CA.
During the most recent reporting year, 12 music education graduations were recorded at Chapman University.
Featured schools near , edit
Online & Distance Learning at Chapman University
Many students take online classes at Chapman University. Of 9,760 students, 1 (0%) were enrolled entirely in distance education and 71 (1%) took at least some classes online.
Music Education Rankings at Chapman University
Use these rankings to compare Chapman University’s Music Education program against peer institutions.
Bachelor’s-Level Rankings
| Ranking | Scope | Rank |
|---|---|---|
| Best Schools (Quality) | California | #None of 3 |
| Best Schools (Quality) | Far Western (Region) | #None of 9 |
| Best Schools (Quality) | Nationwide | #None of 154 |
| Best Value | California | #None of 4 |
| Best Value | Far Western (Region) | #None of 13 |
| Best Value | Nationwide | #None of 332 |
Master’s-Level Rankings
| Ranking | Scope | Rank |
|---|---|---|
| Best Schools (Quality) | California | #None of 3 |
| Best Schools (Quality) | Far Western (Region) | #None of 9 |
| Best Schools (Quality) | Nationwide | #None of 154 |
| Best Value | California | #None of 4 |
| Best Value | Far Western (Region) | #None of 13 |
| Best Value | Nationwide | #None of 332 |
Student Demographics & Diversity
Take a look at the composition of Music Education graduates at Chapman University, by degree type.
Across all degree levels, Music Education graduates at Chapman University are 50% women (6) and 50% men (6).
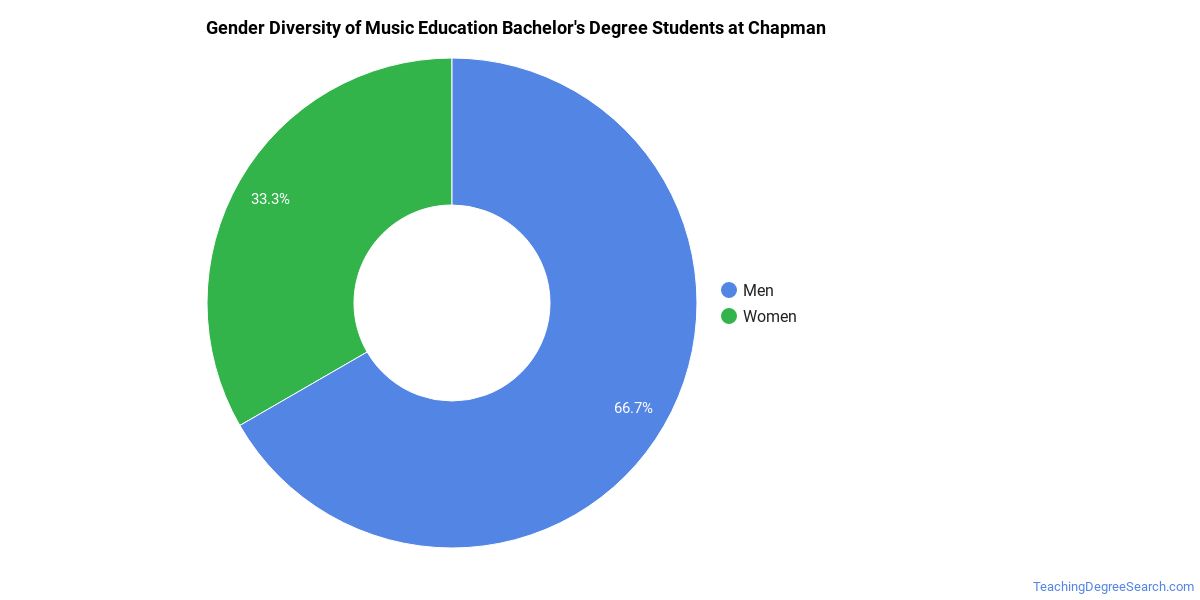
Music Education Bachelor’s Program at Chapman University
Of the 4 bachelor’s music education graduates at Chapman University, 75% were women (3) and 25% were men (1).
The following table and chart show the race/ethnicity of Music Education bachelor’s degree recipients at Chapman University.
| Race / Ethnicity | Number of Graduates |
|---|---|
| White | 1 |
| Hispanic / Latino | 1 |
| Asian | 1 |
| Two or More Races | 1 |
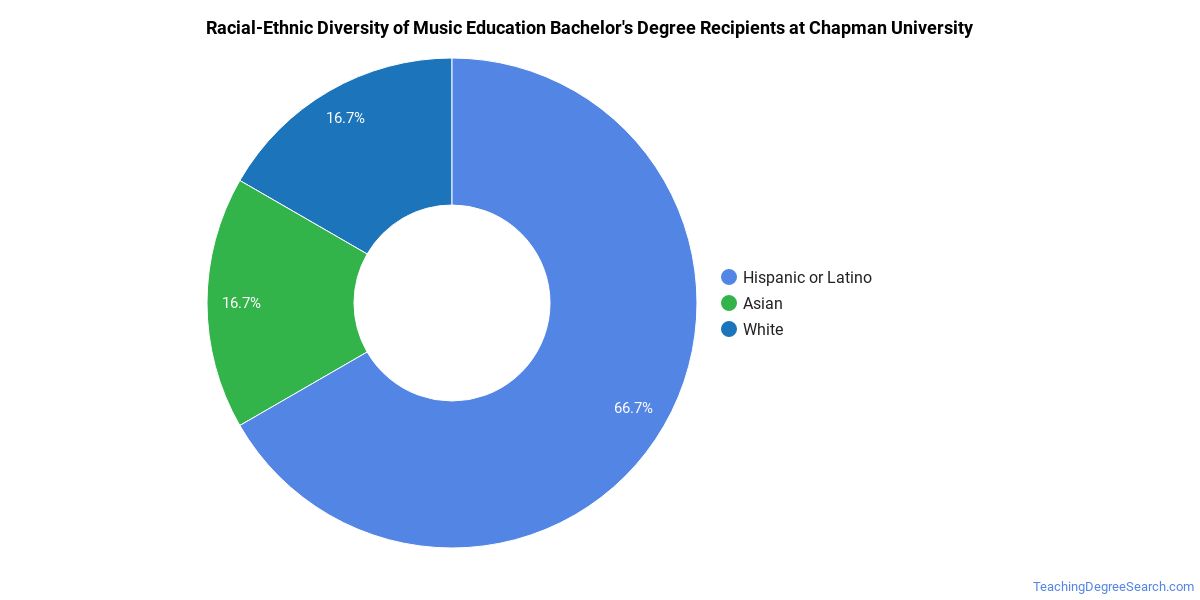
Racial-ethnic minorities make up 75% of Music Education bachelor’s degree recipients at Chapman University, higher than the national average of 23%.*
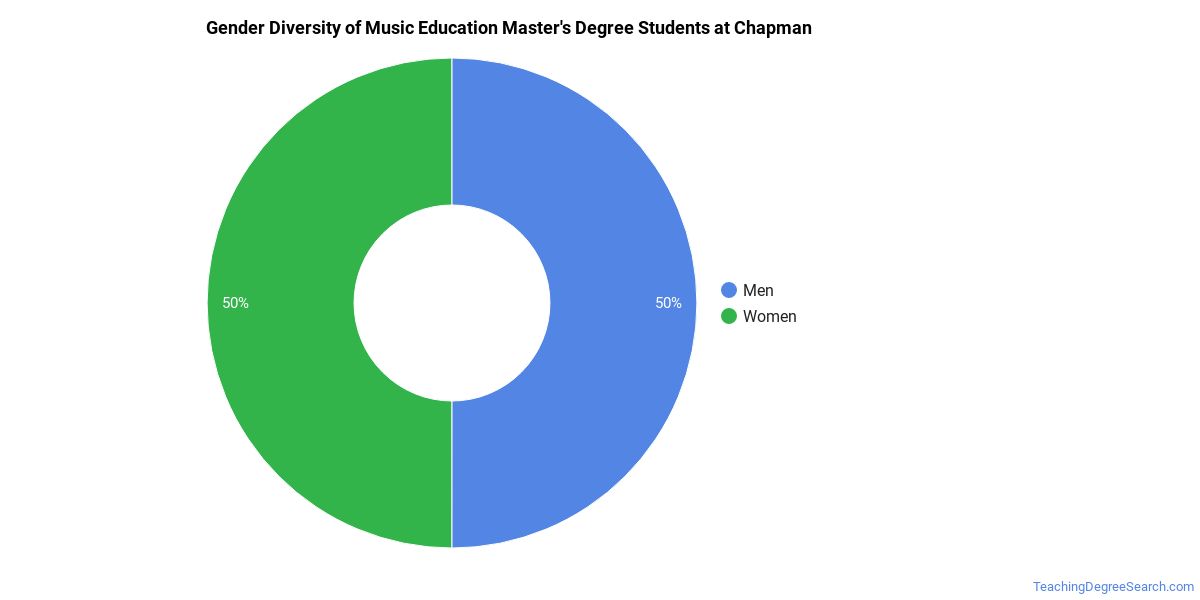
Music Education Master’s Program at Chapman University
Of the 8 master’s music education graduates at Chapman University, 38% were women (3) and 62% were men (5).
The following table and chart show the race/ethnicity of Music Education master’s degree recipients at Chapman University.
| Race / Ethnicity | Number of Graduates |
|---|---|
| White | 3 |
| Hispanic / Latino | 2 |
| Asian | 3 |
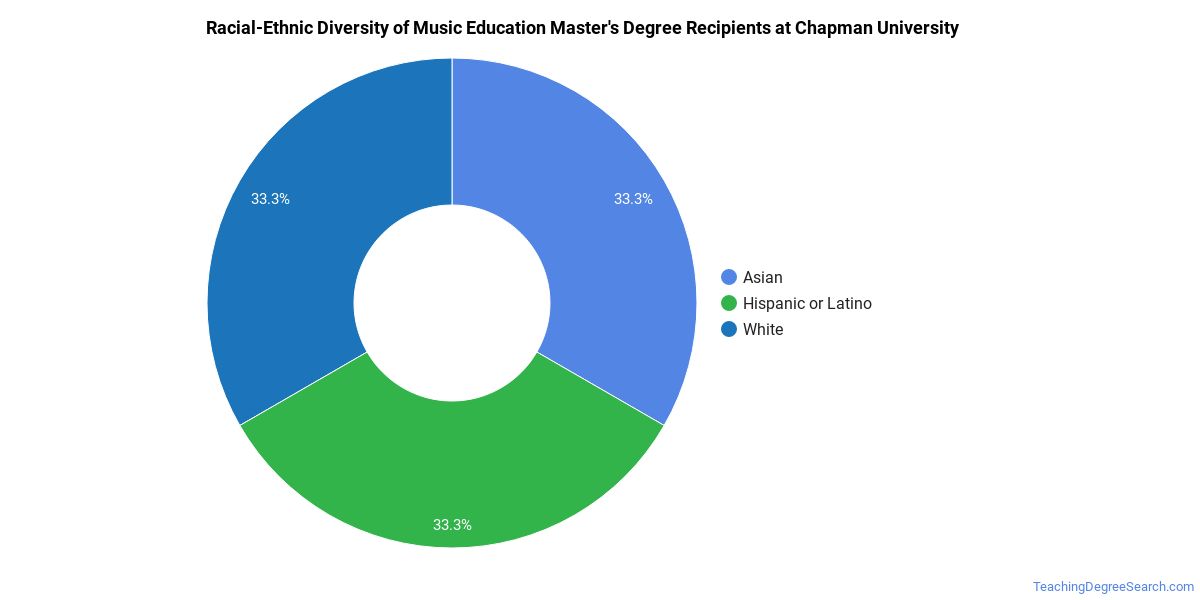
Minority students account for 62% of Music Education master’s degree recipients at Chapman University, higher than the national average of 21%.*
*The racial-ethnic minorities figure is the total number of graduates minus White, international (nonresident), and unknown-race graduates.
Highest-Paying Careers for Music Education Graduates
Students who finish Music Education program at Chapman University pursue many career paths. The table below ranks the best-paid careers for Music Education majors, ordered by median annual salary:
| Occupation | Nationwide Median Wage |
|---|---|
| Education Teachers, Postsecondary | $98,329 |
| Middle School Teachers, Except Special and Career/Technical Education | $83,105 |
| Secondary School Teachers, Except Special and Career/Technical Education | $77,927 |
| Art, Drama, and Music Teachers, Postsecondary | $46,983 |
References
- IPEDS — Integrated Postsecondary Education Data System
- U.S. Department of Education — College Scorecard
- O*NET Online (Bureau of Labor Statistics)
- National Center for Education Statistics
More about our data sources and methodologies.
TeachingDegreeSearch.com provides higher-education, college and university, degree, program, career, salary, and other helpful information to students, faculty, institutions, and other internet audiences. Presented information and data are subject to change. Inclusion on this website does not imply or represent a direct relationship with the company, school, or brand. Information, though believed correct at time of publication, may not be correct, and no warranty is provided. Contact the schools to verify any information before relying on it. Financial aid may be available for those who qualify. The displayed options may include sponsored or recommended results, not necessarily based on your preferences.
© TeachingDegreeSearch.com – All Rights Reserved.