Education at Notre Dame College
NDC is located in Cleveland, Ohio and has a total student population of 1,585.
Want to know more about the career opportunities in this field? Check out the Careers in Education section at the bottom of this page.
NDC Education Degrees Available
- Bachelor’s Degree in Education
- Master’s Degree in Education
Online Classes Are Available at NDC
Don't have the time or the flexibility in your schedule to take traditional classes? Online courses may be the perfect solution for you. They allow independent learners to study when and where they want to while offering the rigor of in-person classes.
For those who are interested in distance learning, NDC does offer online courses in education for the following degree levels:
- Bachelor’s Degree
- Master’s Degree
NDC Education Rankings
The education major at NDC is not ranked on College Factual’s Best Colleges and Universities for Education. This could be for a number of reasons, such as not having enough data on the major or school to make an accurate assessment of its quality.
Education Student Demographics at NDC
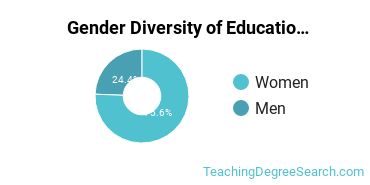
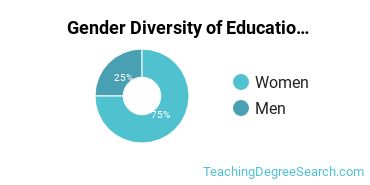
Take a look at the following statistics related to the make-up of the education majors at Notre Dame College.
NDC Education Bachelor’s Program

About 70% of those who receive a bachelor's degree in education at NDC are white. This is above average for this degree on the nationwide level.
The following table and chart show the race/ethnicity for students who recently graduated from Notre Dame College with a bachelor's in education.

| Race/Ethnicity | Number of Students |
|---|---|
| Asian | 0 |
| Black or African American | 2 |
| Hispanic or Latino | 1 |
| White | 16 |
| International Students | 1 |
| Other Races/Ethnicities | 3 |
NDC Education Master’s Program

Of the students who received a education master's degree from NDC, 86% were white. This is above average for this degree on the natiowide level.
The following table and chart show the race/ethnicity for students who recently graduated from Notre Dame College with a master's in education.

| Race/Ethnicity | Number of Students |
|---|---|
| Asian | 0 |
| Black or African American | 2 |
| Hispanic or Latino | 1 |
| White | 24 |
| International Students | 0 |
| Other Races/Ethnicities | 1 |
Concentrations Within Education
The following education concentations are available at Notre Dame College. The completion numbers here include all graduates who receive any type of degree in this field from Notre Dame College. Some of these focus areas may not be available for your degree level.
| Concentration | Annual Degrees Awarded |
|---|---|
| Special Education | 38 |
| Teacher Education Grade Specific | 21 |
| Teacher Education Subject Specific | 8 |
| Educational Administration | 1 |
Careers That Education Grads May Go Into
A degree in education can lead to the following careers. Since job numbers and average salaries can vary by geographic location, we have only included the numbers for OH, the home state for Notre Dame College.
| Occupation | Jobs in OH | Average Salary in OH |
|---|---|---|
| High School Teachers | 52,240 | $61,930 |
| Elementary School Teachers | 51,880 | $62,430 |
| Teacher Assistants | 40,710 | $27,290 |
| Middle School Teachers | 32,080 | $62,130 |
| Preschool Teachers | 15,390 | $29,020 |
References
*The racial-ethnic minorities count is calculated by taking the total number of students and subtracting white students, international students, and students whose race/ethnicity was unknown. This number is then divided by the total number of students at the school to obtain the racial-ethnic minorities percentage.
- College Factual
- National Center for Education Statistics
- O*NET Online
- Image Credit: By Nyttend under License
More about our data sources and methodologies.
