General Education at Salem College
If you are interested in studying General Education, consider the program at Salem College. We’ve gathered the following information to help you decide.
Salem College sits in Winston-Salem, NC.
During the most recent reporting year, 10 general education degrees were awarded at Salem College.
Featured schools near , edit
Online Class Availability at Salem College
Online coursework is an option at Salem College. Of 549 students, 43 (8%) studied exclusively online and 237 (43%) took at least some classes online.
General Education Rankings at Salem College
These rankings give you a sense of how Salem College’s General Education program against peer institutions.
Bachelor’s-Level Rankings
| Ranking | Scope | Rank |
|---|---|---|
| Best Schools (Quality) | North Carolina | #None of 7 |
| Best Schools (Quality) | Southeast (Region) | #None of 87 |
| Best Schools (Quality) | Nationwide | #None of 406 |
| Best Value | North Carolina | #None of 7 |
| Best Value | Southeast (Region) | #None of 87 |
| Best Value | Nationwide | #None of 397 |
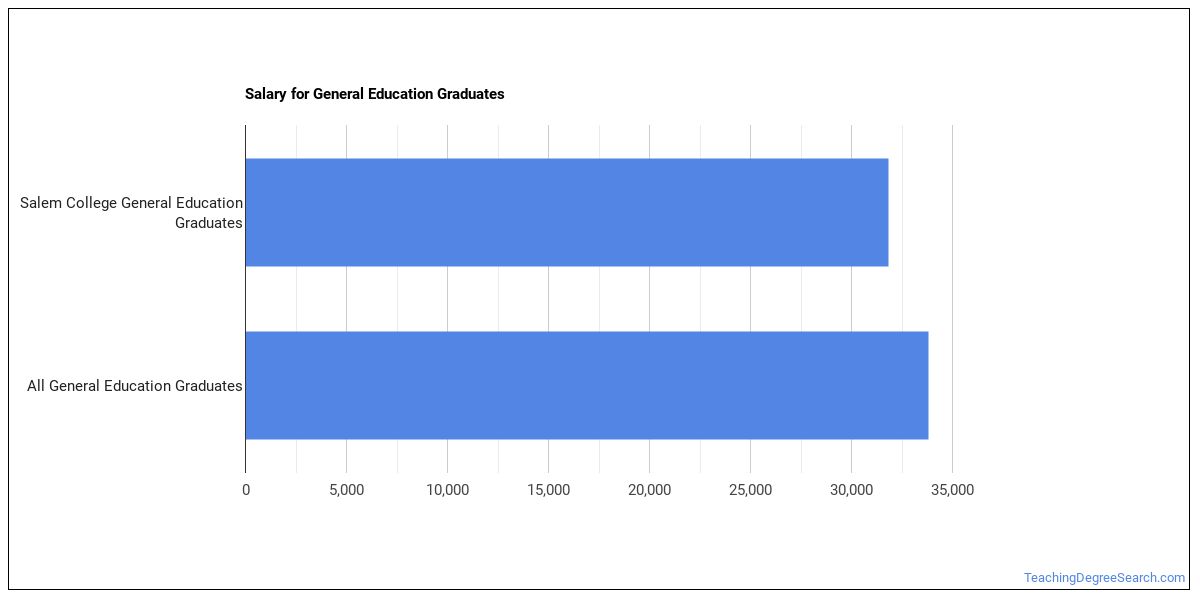
Earnings for General Education Graduates from Salem College
Students who complete Salem College’s General Education program report the following median earnings (per the U.S. Department of Education’s College Scorecard):
| Years After Graduation | Median Earnings |
|---|---|
| 1 year | $31,850 |
| 2 years | $29,685 |
| 4 years | $41,366 |
| 5 years | $46,531 |
How does this compare to the school overall? Four years out, General Education graduates from Salem College earn a median of $41,366, compared with $39,540 for all Salem College graduates — about 5% higher than the school-wide median.

Median Debt at Graduation
Typical debt at graduation for General Education graduates from Salem College stands at $26,407.
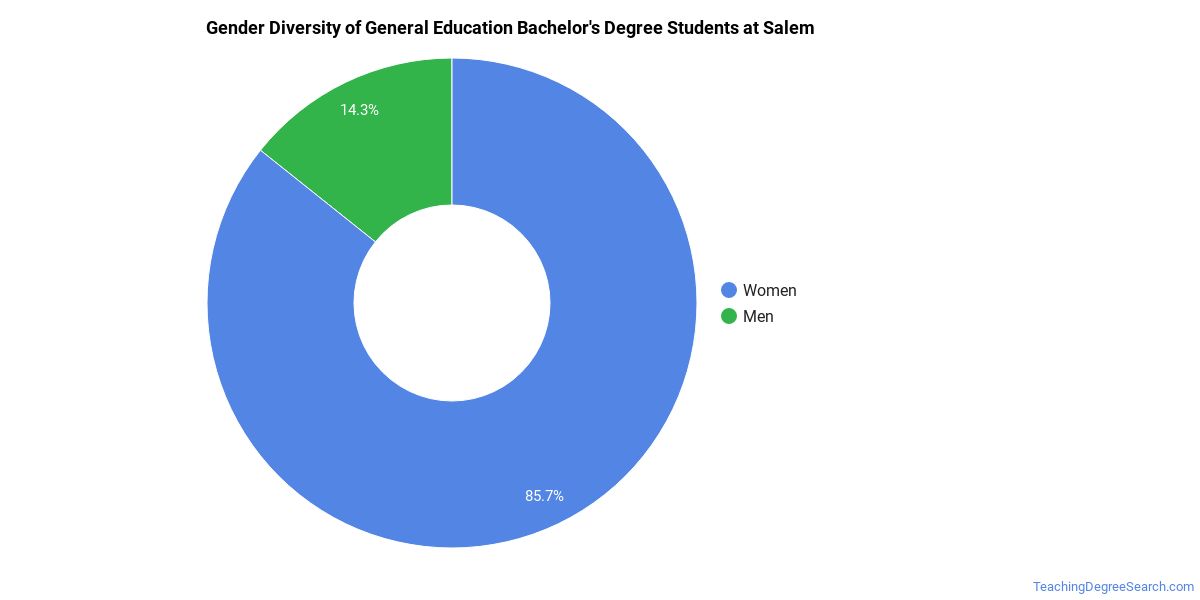
Student Demographics & Diversity
Take a look at the composition of General Education graduates at Salem College, by degree type.
Program-wide, General Education graduates at Salem College are 100% women (10) and 0% men (0).
General Education Bachelor’s Program at Salem College
Among the 10 bachelor’s general education graduates at Salem College, 100% were women (10) and 0% were men (0).
The following table and chart show the race/ethnicity of General Education bachelor’s degree recipients at Salem College.
| Race / Ethnicity | Number of Graduates |
|---|---|
| White | 6 |
| Hispanic / Latino | 1 |
| Black / African American | 1 |
| Asian | 1 |
| Two or More Races | 1 |
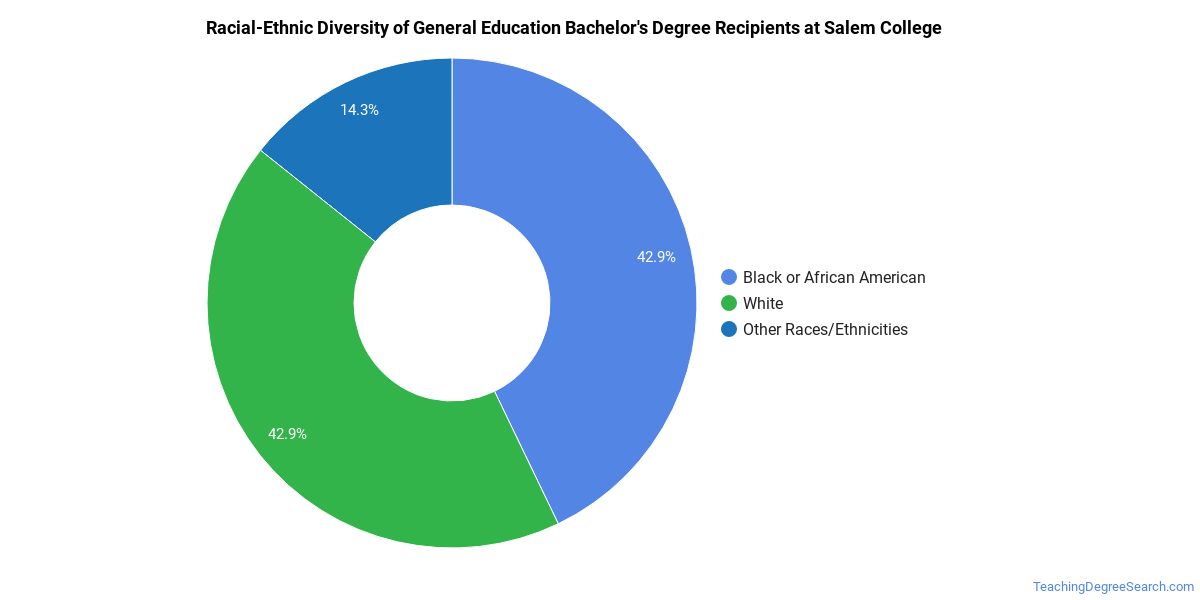
Minority students account for 40% of General Education bachelor’s degree recipients at Salem College, below the national average of 43%.*
*The racial-ethnic minorities figure is the total number of graduates minus White, international (nonresident), and unknown-race graduates.
More Specific General Education Concentrations at Salem College
This General Education program at Salem College offers more specialized concentrations:
| Concentration | Graduates |
|---|---|
| General Education | 10 |
Best-Paid Careers for General Education Graduates
Graduates of the General Education program at Salem College work across a variety of fields. The table below ranks the best-paid careers for General Education majors, ordered by median annual salary:
| Occupation | Nationwide Median Wage |
|---|---|
| Education Teachers, Postsecondary | $98,329 |
| Teaching Assistants, Special Education | $96,801 |
| Teaching Assistants, Preschool, Elementary, Middle, and Secondary School, Except Special Education | $89,337 |
References
- IPEDS — Integrated Postsecondary Education Data System
- U.S. Department of Education — College Scorecard
- O*NET Online (Bureau of Labor Statistics)
- National Center for Education Statistics
More about our data sources and methodologies.
TeachingDegreeSearch.com provides higher-education, college and university, degree, program, career, salary, and other helpful information to students, faculty, institutions, and other internet audiences. Presented information and data are subject to change. Inclusion on this website does not imply or represent a direct relationship with the company, school, or brand. Information, though believed correct at time of publication, may not be correct, and no warranty is provided. Contact the schools to verify any information before relying on it. Financial aid may be available for those who qualify. The displayed options may include sponsored or recommended results, not necessarily based on your preferences.
© TeachingDegreeSearch.com – All Rights Reserved.