Social Studies Education at SUNY Old Westbury
If you plan to study Social Studies Education, consider the program at SUNY Old Westbury. We’ve gathered the following information to help you decide.
SUNY Old Westbury is located in Old Westbury, NY.
In the most recent year for which we have data, 32 social studies education degrees were awarded at SUNY Old Westbury.
Featured schools near , edit
Online & Distance Learning at SUNY Old Westbury
Many students take online classes at SUNY Old Westbury. Among 4,709 students, 292 (6%) studied exclusively online and 1,645 (35%) took at least some classes online.
Social Studies Education Rankings at SUNY Old Westbury
Rankings can help you compare SUNY Old Westbury’s Social Studies Education program against other schools offering the same major.
Bachelor’s-Level Rankings
| Ranking | Scope | Rank |
|---|---|---|
| Best Value | New York | #6 of 40 |
| Best Value | Middle Atlantic (Region) | #7 of 58 |
| Best Value | Nationwide | #8 of 200 |
| Best Schools (Quality) | New York | #10 of 21 |
| Best Schools (Quality) | Middle Atlantic (Region) | #13 of 25 |
| Best Schools (Quality) | Nationwide | #21 of 62 |
Master’s-Level Rankings
| Ranking | Scope | Rank |
|---|---|---|
| Best Value | New York | #6 of 40 |
| Best Value | Middle Atlantic (Region) | #7 of 58 |
| Best Value | Nationwide | #8 of 200 |
| Best Schools (Quality) | New York | #10 of 21 |
| Best Schools (Quality) | Middle Atlantic (Region) | #13 of 25 |
| Best Schools (Quality) | Nationwide | #21 of 62 |
Student Demographics & Diversity
The following sections describe the composition of Social Studies Education graduates at SUNY Old Westbury, broken down by degree level.
Program-wide, Social Studies Education graduates at SUNY Old Westbury are 31% women (10) and 69% men (22).
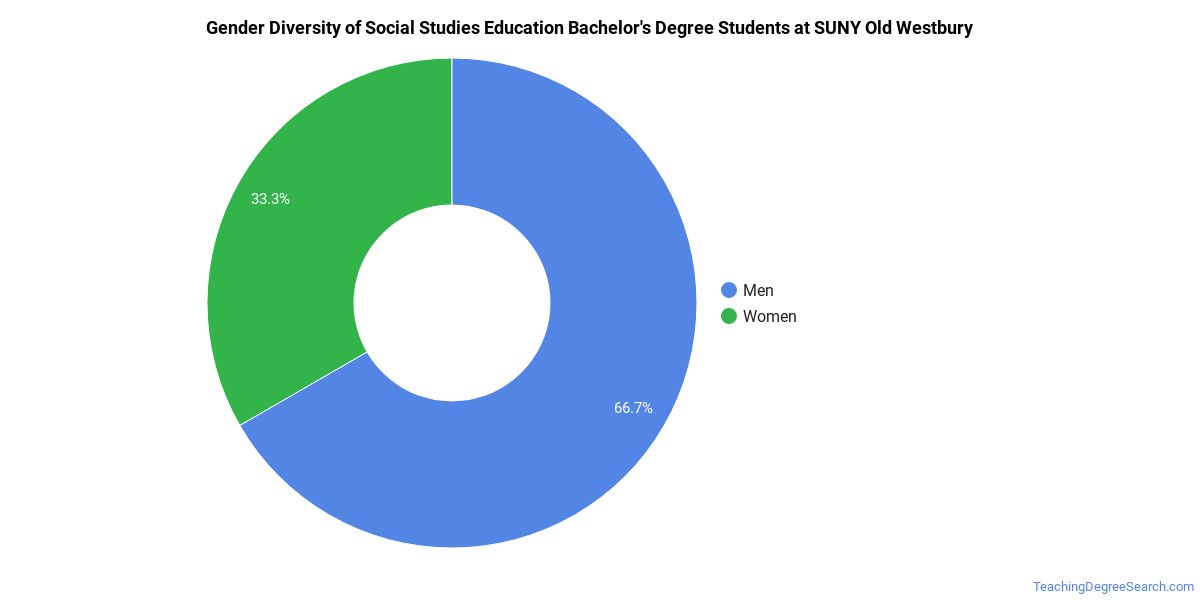
Social Studies Education Bachelor’s Program at SUNY Old Westbury
Among the 6 bachelor’s social studies education graduates at SUNY Old Westbury, 33% were women (2) and 67% were men (4).
The following table and chart show the race/ethnicity of Social Studies Education bachelor’s degree recipients at SUNY Old Westbury.
| Race / Ethnicity | Number of Graduates |
|---|---|
| White | 3 |
| Hispanic / Latino | 3 |
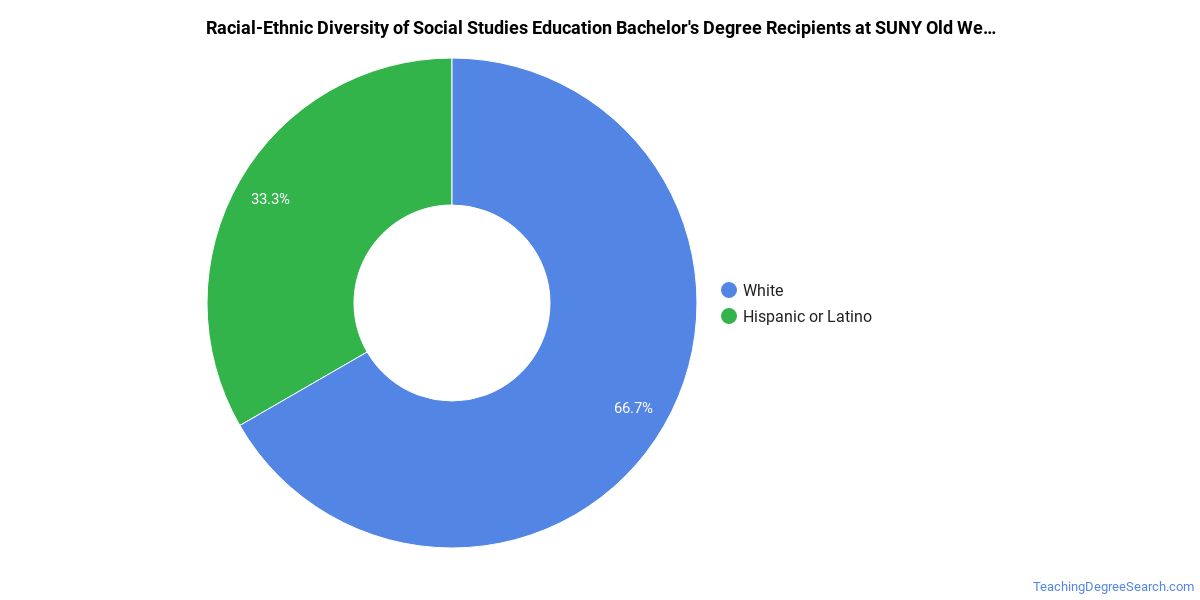
Minority students account for 50% of Social Studies Education bachelor’s degree recipients at SUNY Old Westbury, above the national average of 14%.*
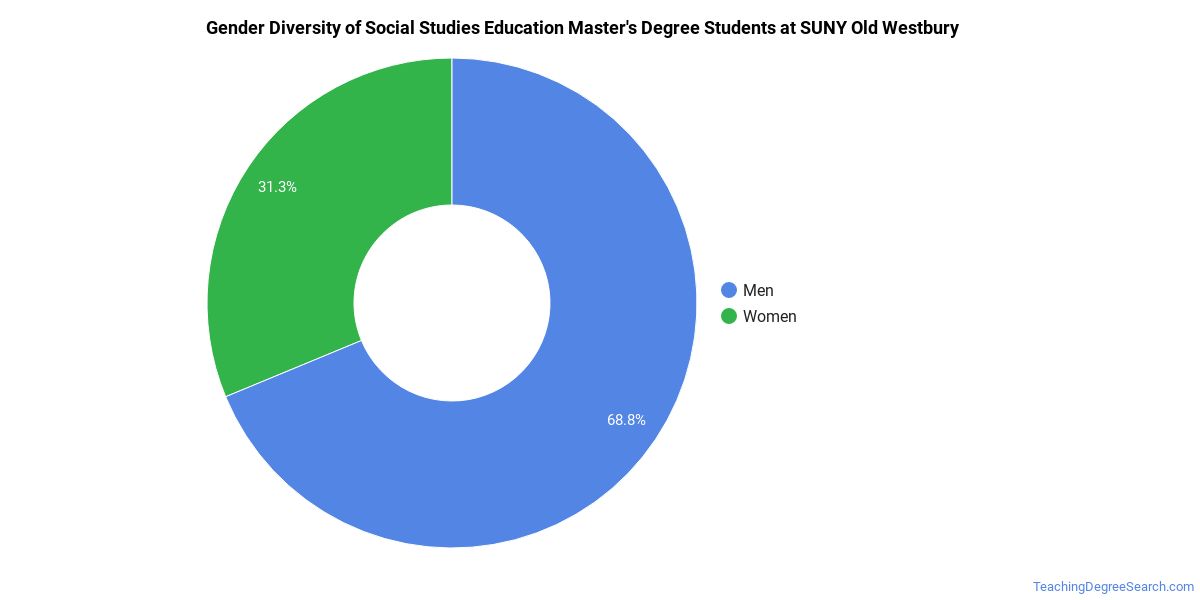
Social Studies Education Master’s Program at SUNY Old Westbury
Of the 26 master’s social studies education degrees awarded at SUNY Old Westbury, 31% were women (8) and 69% were men (18).
The following table and chart show the race/ethnicity of Social Studies Education master’s degree recipients at SUNY Old Westbury.
| Race / Ethnicity | Number of Graduates |
|---|---|
| White | 18 |
| Hispanic / Latino | 3 |
| Black / African American | 1 |
| American Indian / Alaska Native | 1 |
| Two or More Races | 2 |
| International (Nonresident) | 1 |
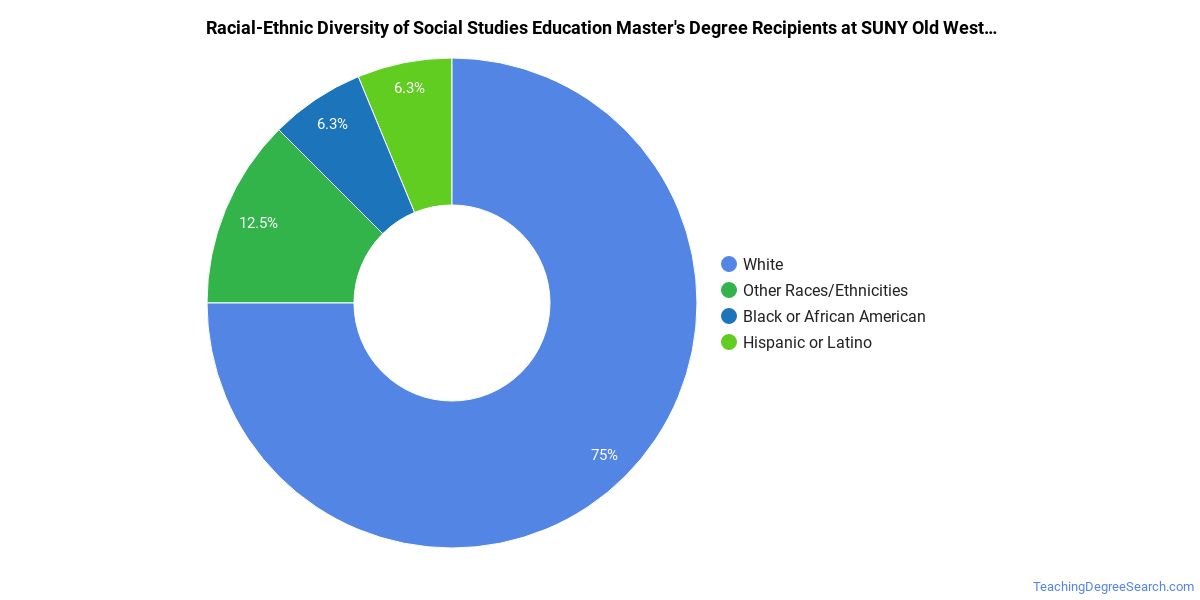
Racial-ethnic minorities make up 27% of Social Studies Education master’s degree recipients at SUNY Old Westbury, above the national average of 26%.*
*The racial-ethnic minorities figure is the total number of graduates minus White, international (nonresident), and unknown-race graduates.
Highest-Paying Careers for Social Studies Education Graduates
Those who complete Social Studies Education program at SUNY Old Westbury go on to a range of careers. Here are the top-paying careers for Social Studies Education majors, ordered by median annual salary:
| Occupation | Nationwide Median Wage |
|---|---|
| Middle School Teachers, Except Special and Career/Technical Education | $83,105 |
| Secondary School Teachers, Except Special and Career/Technical Education | $77,927 |
References
- IPEDS — Integrated Postsecondary Education Data System
- U.S. Department of Education — College Scorecard
- O*NET Online (Bureau of Labor Statistics)
- National Center for Education Statistics
More about our data sources and methodologies.
TeachingDegreeSearch.com provides higher-education, college and university, degree, program, career, salary, and other helpful information to students, faculty, institutions, and other internet audiences. Presented information and data are subject to change. Inclusion on this website does not imply or represent a direct relationship with the company, school, or brand. Information, though believed correct at time of publication, may not be correct, and no warranty is provided. Contact the schools to verify any information before relying on it. Financial aid may be available for those who qualify. The displayed options may include sponsored or recommended results, not necessarily based on your preferences.
© TeachingDegreeSearch.com – All Rights Reserved.