University of Arkansas at Monticello Teaching Programs
University of Arkansas at Monticello is a public institution located in Monticello, AR. A Remote Town offers a peaceful environment near the excitement of urban amenities.
Featured schools near , edit
University of Arkansas at Monticello Rankings
UAM is featured in these rankings for teaching programs at the bachelors level:
| Ranking | Rank | Among |
|---|---|---|
| Overall Quality | #27 of 66 | State — Arkansas |
| Overall Quality | #392 of 1,106 | Region — Southeast |
| Overall Quality | #1987 of 4,630 | Nationwide |
Where Is University of Arkansas at Monticello?
Contact information for UAM can be found below.
| Contact Details | |
|---|---|
| Address: | Highway 425 South, Monticello, AR 71656 |
| Phone: | 8704601026 |
| Website: | www.uamont.edu/ |
| Admissions: | www.uamont.edu/admissions/index.html |
| Financial Aid: | www.uamont.edu/financial-aid/index.html |
How Do I Get Into UAM?
You can apply to UAM online at: https://weevilnetcs.uamont.cloud/psc/csprd/EMPLOYEE/SA/c/CTF_MENU.CTF_C_SIGNON.GBL?Page=CTF_C_SIGNON&Action=U&CTF_ID=UAM_APP1&TargetFrameName=None
How Hard Is It To Get Into UAM?
Average Test Scores
Can I Afford University of Arkansas at Monticello?
The average net price after aid at UAM is $14,013. The affordability of the school largely depends on your financial need since net price varies by income group.
Tuition & Fees
| Category | Cost |
|---|---|
| In-State Tuition | $5,685 |
| In-State Fees | $3,607 |
| Out-of-State Tuition | $11,250 |
| Out-of-State Fees | $3,607 |
| Total In-State Tuition & Fees | $9,292 |
| Total Out-of-State Tuition & Fees | $14,857 |
Financial Aid
Across all aid types, 20% of students at UAM receive some form of financial aid (461 students).
Approximately 73% of students at UAM receive grant or scholarship aid, averaging $9,566 per student.
50% of students receive federal Pell Grants, averaging $6,041.
Student Loan Debt
39% of UAM undergraduates take out federal student loans, averaging $7,401 per year.
University of Arkansas at Monticello Undergraduate Student Diversity
There are 892 students enrolled at UAM. UAM is classified as a 1,000 - 4,999 institution by enrollment size. Its Carnegie Classification is Master’s Colleges & Universities: Medium Programs.
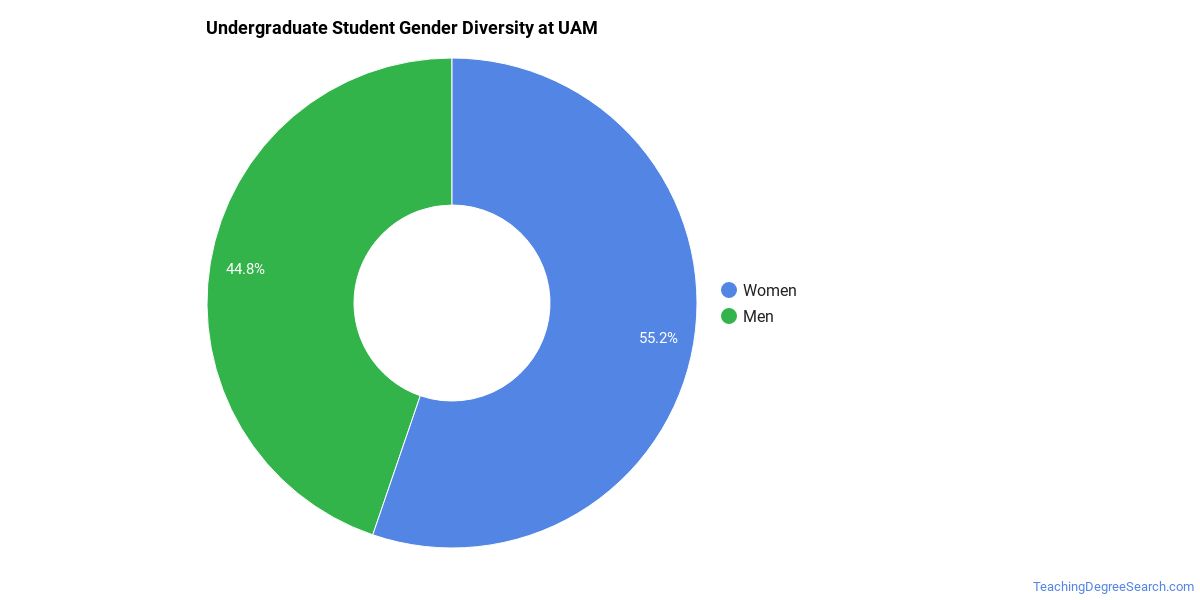
Gender Diversity
Of the 1,868 undergraduate students at UAM, approximately 40% are male and 60% are female.
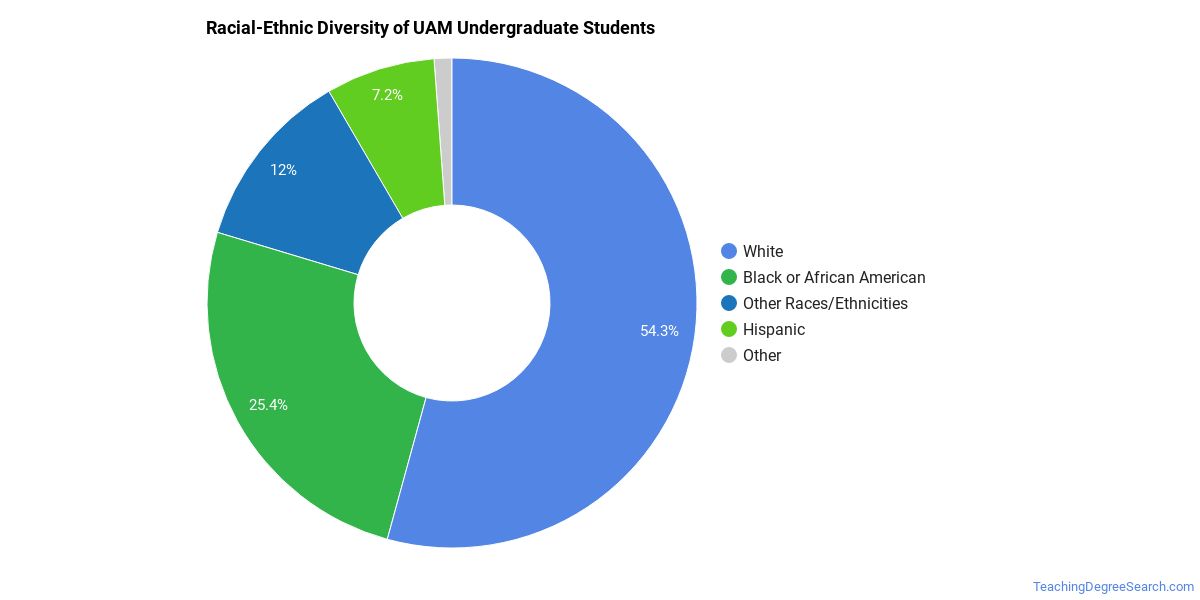
Racial-Ethnic Diversity
The racial-ethnic breakdown of University of Arkansas at Monticello undergraduate students is as follows.
| Race/Ethnicity | Number of Students |
|---|---|
| Asian | 7 |
| Black or African American | 569 |
| Hispanic | 198 |
| White | 997 |
| American Indian/Alaska Native | 5 |
| Native Hawaiian/Pacific Islander | 3 |
| Two or More Races | 78 |
| Non-Resident | 11 |
Geographic Diversity
The top 5 home states of first-time undergraduate students at UAM are listed below.

| State | First-Time UG Students |
|---|---|
| Arkansas | 428 |
| Texas | 28 |
| Louisiana | 27 |
| Mississippi | 5 |
| Oklahoma | 5 |
Additionally, approximately 0.6% of undergraduate students are non-resident from outside the United States.
University of Arkansas at Monticello Graduate Student Diversity
411 of UAM’s students are in graduate programs. The highest graduate-level award offered is Master’s degree.
Gender Diversity (Graduate)
Among graduate students at UAM, approximately 35% are male and 65% are female.

Racial-Ethnic Diversity (Graduate)
The racial-ethnic breakdown of University of Arkansas at Monticello graduate students is as follows.

| Race/Ethnicity | Number of Students |
|---|---|
| Asian | 3 |
| Black or African American | 129 |
| Hispanic | 13 |
| White | 240 |
| American Indian/Alaska Native | 1 |
| Native Hawaiian/Pacific Islander | 1 |
| Two or More Races | 13 |
| Non-Resident | 9 |
Online Learning at University of Arkansas at Monticello
UAM delivers distance learning options for students who need flexibility.
1,247 undergraduate students at UAM took at least one online class — of those, 327 took all of their classes online.
At the graduate level, 11 students took at least one online class and 362 took all classes online. Distance education is available at the undergraduate and graduate levels.
Teaching Programs at University of Arkansas at Monticello
Below are the teaching programs are offered at UAM, showing degrees awarded by level in the most recent reporting year.
| Program | Bachelor’s | Master’s | Doctorate | Total |
|---|---|---|---|---|
| Teacher Education and Professional Development, Specific Levels and Methods | 9 | 149 | — | 177 |
| Education, General | 37 | — | — | 37 |
| Educational Administration and Supervision | — | 3 | — | 3 |
Academic Programs at University of Arkansas at Monticello
UAM offers 25 distinct academic programs.
The highest level of award offered is Master’s degree.
Institutional Profile
UAM has an open admission policy: Yes. Credit transfer:
- AP credits: Yes
- Dual enrollment credits: Yes
- Life experience credits: Implied no
References
More about our data sources and methodologies.
TeachingDegreeSearch.com provides higher-education, college and university, degree, program, career, salary, and other helpful information to students, faculty, institutions, and other internet audiences. Presented information and data are subject to change. Inclusion on this website does not imply or represent a direct relationship with the company, school, or brand. Information, though believed correct at time of publication, may not be correct, and no warranty is provided. Contact the schools to verify any information before relying on it. Financial aid may be available for those who qualify. The displayed options may include sponsored or recommended results, not necessarily based on your preferences.
© TeachingDegreeSearch.com – All Rights Reserved.