Music Education at University of Louisville
If you are interested in studying Music Education, you may want to check out the program at University of Louisville. Get started with the following essential facts.
University of Louisville is located in Louisville, KY.
In the most recent year for which we have data, 17 music education graduations were recorded at University of Louisville.
Featured schools near , edit
Online Class Availability at University of Louisville
Distance learning is available at University of Louisville. Among 23,065 students, 4,555 (20%) studied exclusively online and 9,040 (39%) took at least some classes online.
Music Education Rankings at University of Louisville
These rankings give you a sense of how University of Louisville’s Music Education program to other colleges that offer this major.
Bachelor’s-Level Rankings
| Ranking | Scope | Rank |
|---|---|---|
| Best Schools (Quality) | Kentucky | #1 of 2 |
| Best Value | Kentucky | #6 of 7 |
| Best Schools (Quality) | Southeast (Region) | #8 of 34 |
| Best Value | Southeast (Region) | #39 of 76 |
| Best Schools (Quality) | Nationwide | #55 of 154 |
| Best Value | Nationwide | #141 of 332 |
Master’s-Level Rankings
| Ranking | Scope | Rank |
|---|---|---|
| Best Schools (Quality) | Kentucky | #1 of 2 |
| Best Value | Kentucky | #6 of 7 |
| Best Schools (Quality) | Southeast (Region) | #8 of 34 |
| Best Value | Southeast (Region) | #39 of 76 |
| Best Schools (Quality) | Nationwide | #55 of 154 |
| Best Value | Nationwide | #141 of 332 |
Student Demographics & Diversity
The following sections describe the composition of Music Education graduates at University of Louisville, by degree type.
Program-wide, Music Education graduates at University of Louisville are 59% women (10) and 41% men (7).
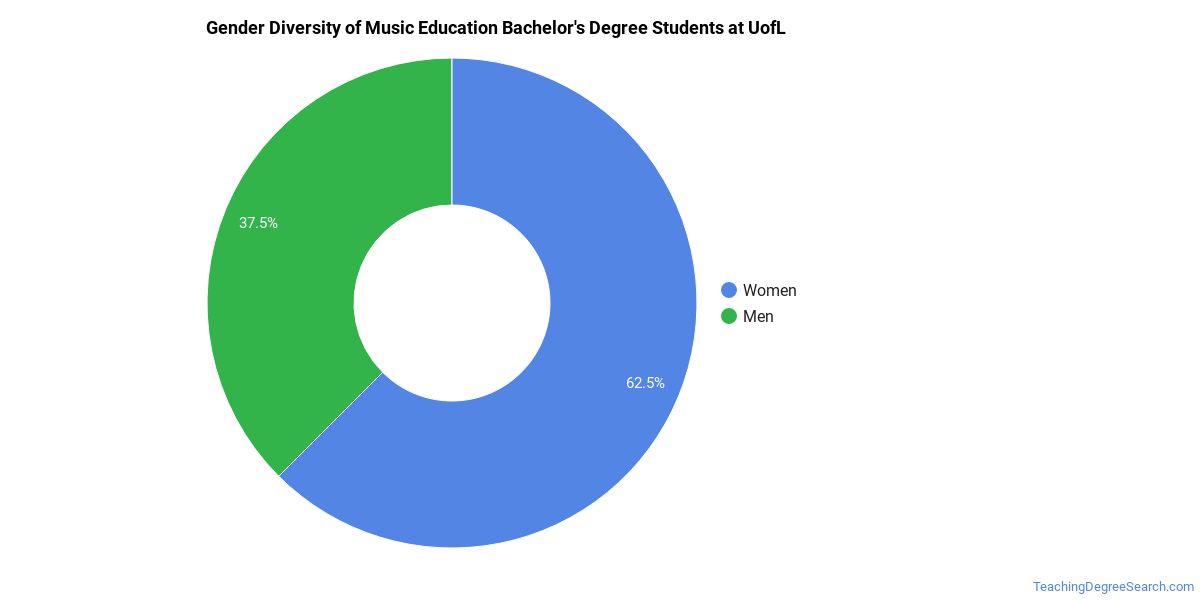
Music Education Bachelor’s Program at University of Louisville
Of the 16 bachelor’s music education degrees awarded at University of Louisville, 56% were women (9) and 44% were men (7).
The following table and chart show the race/ethnicity of Music Education bachelor’s degree recipients at University of Louisville.
| Race / Ethnicity | Number of Graduates |
|---|---|
| White | 12 |
| American Indian / Alaska Native | 1 |
| Two or More Races | 3 |
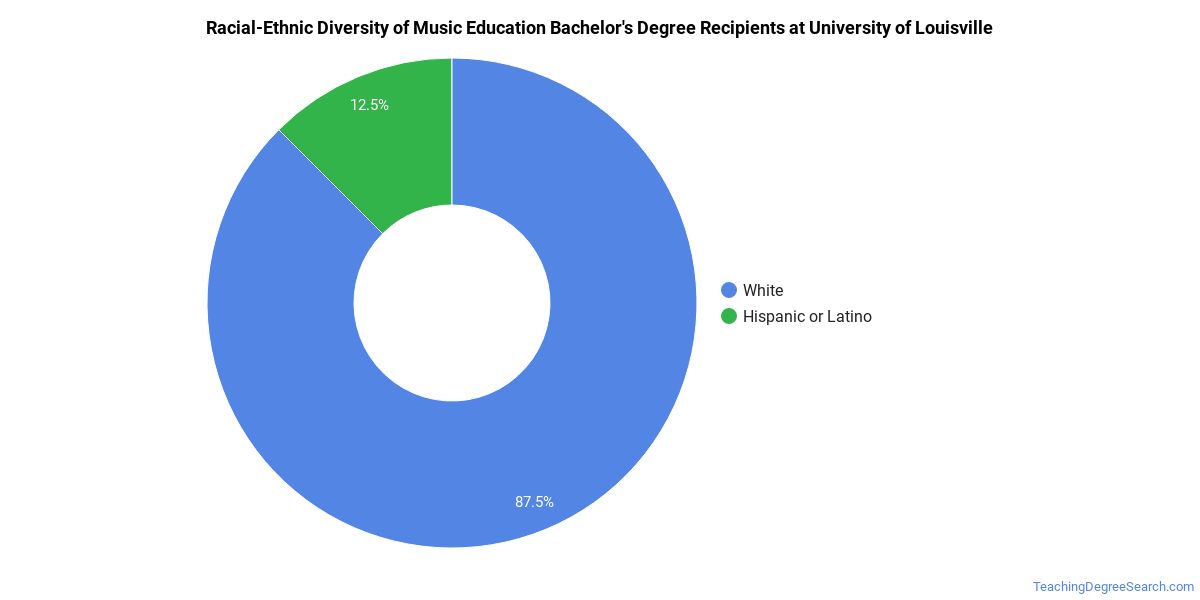
Minority students account for 25% of Music Education bachelor’s degree recipients at University of Louisville, above the national average of 23%.*
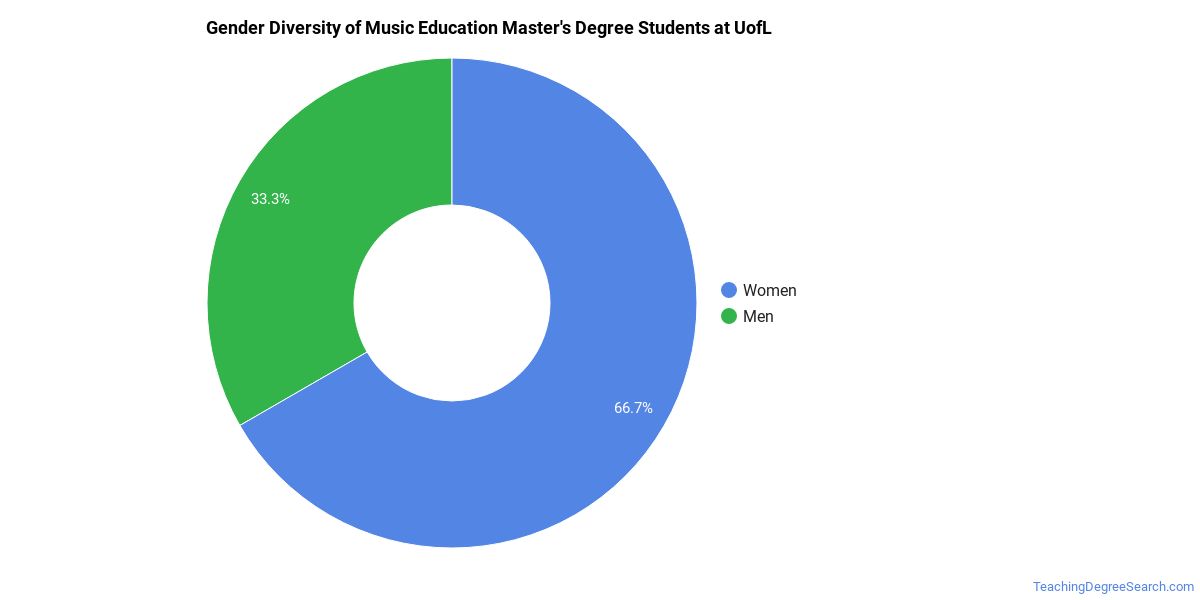
Music Education Master’s Program at University of Louisville
Of the 1 master’s music education degrees awarded at University of Louisville, 100% were women (1) and 0% were men (0).
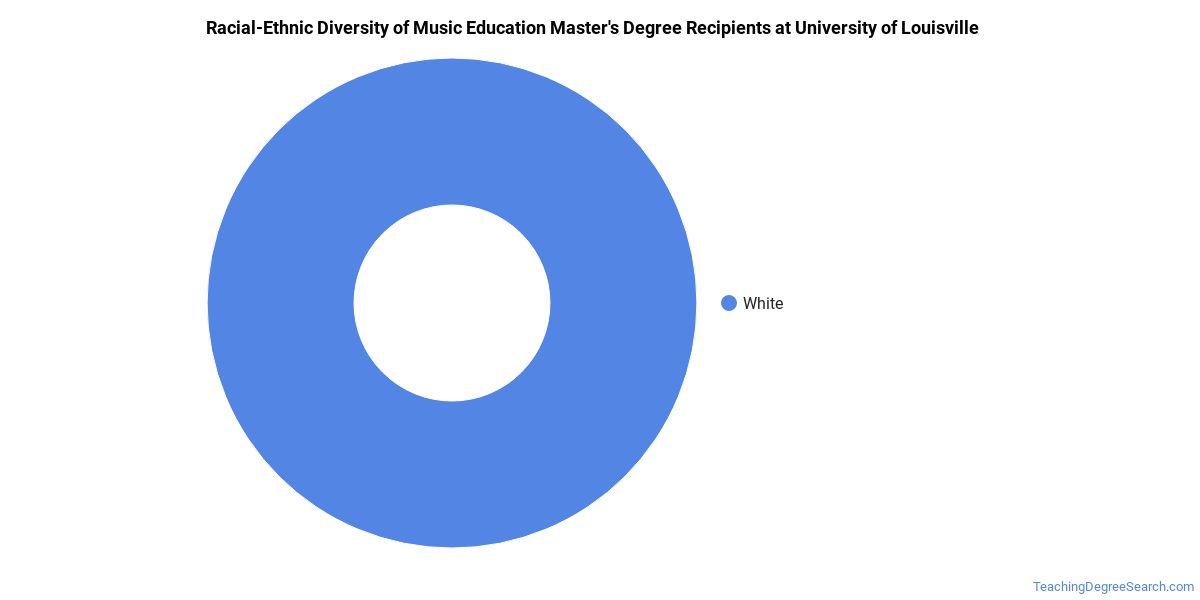
The following table and chart show the race/ethnicity of Music Education master’s degree recipients at University of Louisville.
| Race / Ethnicity | Number of Graduates |
|---|---|
| White | 1 |
*The racial-ethnic minorities figure is the total number of graduates minus White, international (nonresident), and unknown-race graduates.
Best-Paid Careers for Music Education Graduates
Students who finish Music Education program at University of Louisville work across a variety of fields. Below are the best-paid careers for Music Education majors, ordered by median annual salary:
| Occupation | Nationwide Median Wage |
|---|---|
| Education Teachers, Postsecondary | $98,329 |
| Middle School Teachers, Except Special and Career/Technical Education | $83,105 |
| Secondary School Teachers, Except Special and Career/Technical Education | $77,927 |
| Art, Drama, and Music Teachers, Postsecondary | $46,983 |
References
- IPEDS — Integrated Postsecondary Education Data System
- U.S. Department of Education — College Scorecard
- O*NET Online (Bureau of Labor Statistics)
- National Center for Education Statistics
More about our data sources and methodologies.
TeachingDegreeSearch.com provides higher-education, college and university, degree, program, career, salary, and other helpful information to students, faculty, institutions, and other internet audiences. Presented information and data are subject to change. Inclusion on this website does not imply or represent a direct relationship with the company, school, or brand. Information, though believed correct at time of publication, may not be correct, and no warranty is provided. Contact the schools to verify any information before relying on it. Financial aid may be available for those who qualify. The displayed options may include sponsored or recommended results, not necessarily based on your preferences.
© TeachingDegreeSearch.com – All Rights Reserved.