University of Mary Washington Teaching Programs
University of Mary Washington is a public institution located in Fredericksburg, VA. A Suburban Area offers a peaceful environment near the excitement of urban amenities.
Featured schools near , edit
Where Is University of Mary Washington?

Contact details for Mary Washington College are listed below.
| Contact Details | |
|---|---|
| Address: | 1301 College Ave, Fredericksburg, VA 22401-5300 |
| Phone: | 5406541000 |
| Website: | www.umw.edu/ |
| Admissions: | www.umw.edu/admissions/ |
| Financial Aid: | www.umw.edu/financialaid/ |
How Do I Get Into Mary Washington College?
You can apply to Mary Washington College online at: https://www.umw.edu/admissions/apply/
Mary Washington College is classified as Less Selective (70-85%) for admissions.
Admission Requirements for Mary Washington College
These are the things Mary Washington College looks for in applicants:
| Requirement | Status |
|---|---|
| Secondary School Record | Required |
| Secondary School GPA | Required |
| Recommendations | Considered but not required |
| Admission Test Scores (SAT/ACT) | Considered but not required |
How Hard Is It To Get Into Mary Washington College?
Mary Washington College has an acceptance rate of 80%, which makes it highly accessible. Ensure you meet all application requirements and prepare the application in full.
Of those admitted, 18% choose to enroll — a modest enrollment yield, suggesting many admitted students choose other institutions.
Average Test Scores
26% of admitted students submitted SAT scores and 4% submitted ACT scores.
When looking at the 25th through the 75th percentile of admitted students at Mary Washington College, SAT Evidence-Based Reading and Writing scores ranged between 610 and 710. Math scores were between 560 and 660.
Selectivity by Gender
Selectivity numbers at Mary Washington College can differ by gender.
| Gender | Applicants | Admitted | Acceptance Rate |
|---|---|---|---|
| Men | 1,822 | 1,376 | 76% |
| Women | 3,302 | 2,712 | 82% |
Can I Afford University of Mary Washington?
The average net price after aid at Mary Washington College is $21,108. The affordability of the school largely depends on your financial need since net price varies by income group.
Tuition & Fees
| Category | Cost |
|---|---|
| In-State Tuition | $9,117 |
| In-State Fees | $5,788 |
| Out-of-State Tuition | $22,295 |
| Out-of-State Fees | $5,788 |
| Total In-State Tuition & Fees | $14,905 |
| Total Out-of-State Tuition & Fees | $28,083 |
Financial Aid
When including loans, work-study, and grants, 20% of students at Mary Washington College receive some form of financial aid (737 students).
Approximately 72% of students at Mary Washington College receive grant or scholarship aid, averaging $9,859 per student.
21% of students receive federal Pell Grants, averaging $5,493.
Student Loan Debt
29% of Mary Washington College undergraduates take out federal student loans, averaging $6,470 per year.
University of Mary Washington Undergraduate Student Diversity
There are 298 students enrolled at Mary Washington College. Mary Washington College is classified as a 1,000 - 4,999 institution by enrollment size. Its Carnegie Classification is Baccalaureate Colleges: Arts & Sciences Focus.
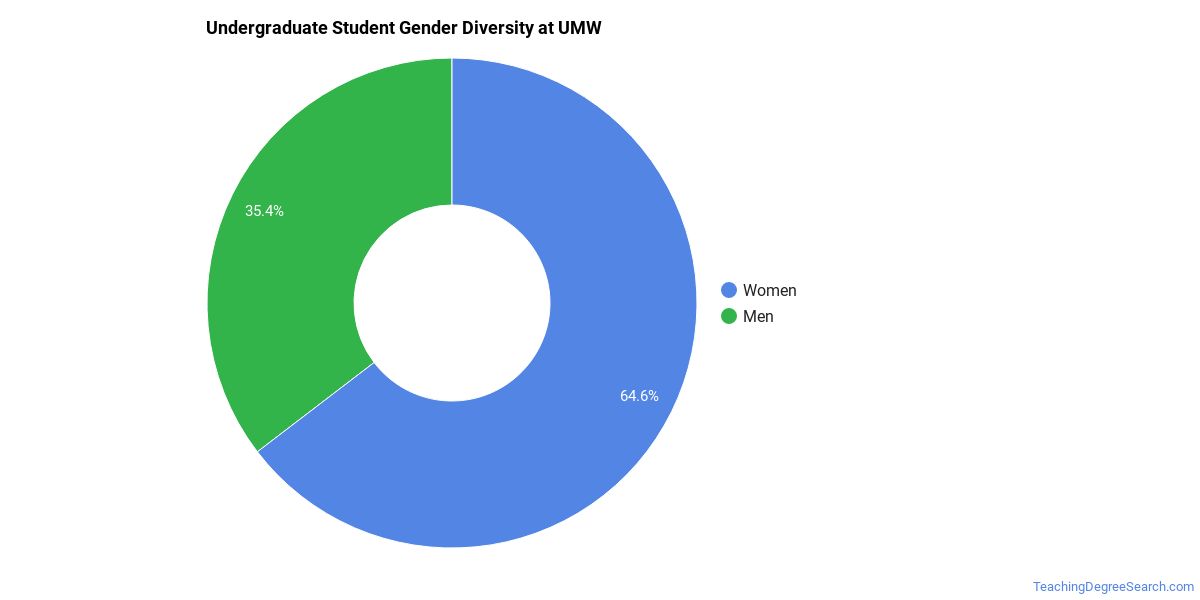
Gender Diversity
Of the 3,504 undergraduate students at Mary Washington College, approximately 35% are male and 65% are female.
Racial-Ethnic Diversity
The racial-ethnic breakdown of University of Mary Washington undergraduate students is as follows.
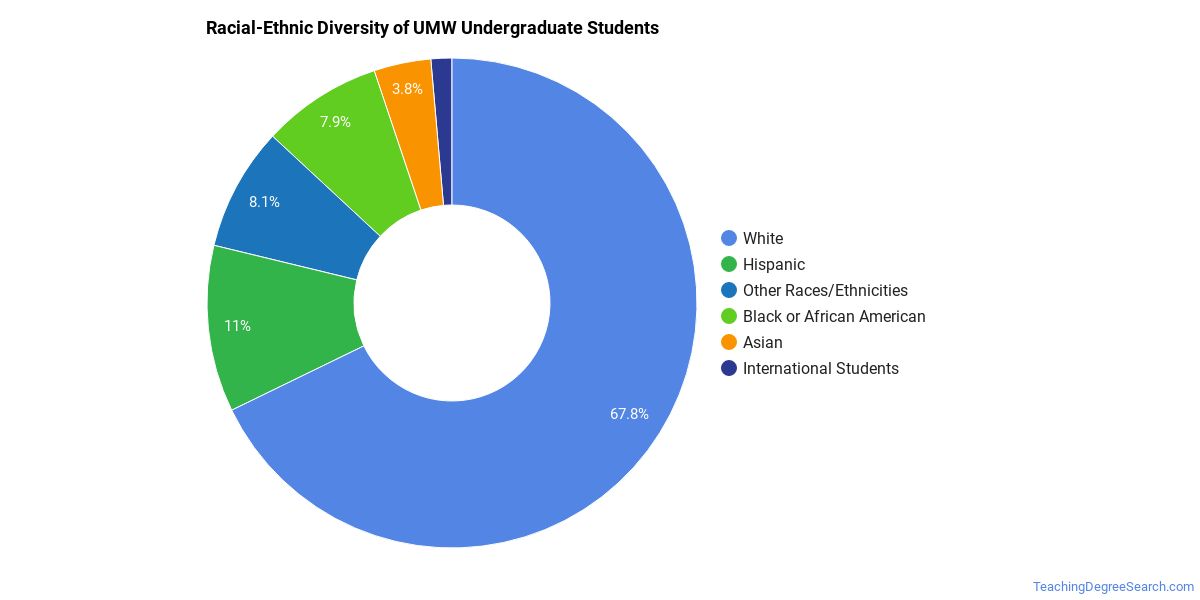
| Race/Ethnicity | Number of Students |
|---|---|
| Asian | 150 |
| Black or African American | 287 |
| Hispanic | 452 |
| White | 2,077 |
| American Indian/Alaska Native | 7 |
| Native Hawaiian/Pacific Islander | 3 |
| Two or More Races | 210 |
| Non-Resident | 98 |
Geographic Diversity
The top 5 home states of first-time undergraduate students at Mary Washington College break down as follows.

| State | First-Time UG Students |
|---|---|
| Virginia | 636 |
| Maryland | 20 |
| Pennsylvania | 9 |
| North Carolina | 6 |
| New Jersey | 4 |
Additionally, approximately 2.8% of undergraduate students are non-resident from outside the United States.
University of Mary Washington Graduate Student Diversity
197 of Mary Washington College’s students are in graduate programs. The highest graduate-level award offered is Master’s degree.
Gender Diversity (Graduate)
Among graduate students at Mary Washington College, approximately 40% are male and 60% are female.

Racial-Ethnic Diversity (Graduate)
The racial-ethnic breakdown of University of Mary Washington graduate students is as follows.

| Race/Ethnicity | Number of Students |
|---|---|
| Asian | 11 |
| Black or African American | 22 |
| Hispanic | 17 |
| White | 117 |
| Two or More Races | 3 |
| Non-Resident | 4 |
Online Learning at University of Mary Washington
Mary Washington College delivers distance learning options for students who need flexibility.
933 undergraduate students at Mary Washington College took at least one online class — of those, 170 took all of their classes online.
At the graduate level, 45 students took at least one online class and 85 took all classes online. Distance education is available at the undergraduate and graduate levels.
Teaching Programs at University of Mary Washington
The following teaching programs are offered at Mary Washington College, with per-level degree counts in the most recent reporting year.
| Program | Bachelor’s | Master’s | Doctorate | Total |
|---|---|---|---|---|
| Teacher Education and Professional Development, Specific Levels and Methods | 44 | 12 | — | 56 |
| Education, General | — | 27 | — | 27 |
Academic Programs at University of Mary Washington
Mary Washington College offers 18 distinct academic programs.
The highest level of award offered is Master’s degree.
Institutional Profile
Mary Washington College has an open admission policy: No. Credit transfer:
- AP credits: Yes
- Dual enrollment credits: Yes
- Life experience credits: Implied no
References
More about our data sources and methodologies.
TeachingDegreeSearch.com provides higher-education, college and university, degree, program, career, salary, and other helpful information to students, faculty, institutions, and other internet audiences. Presented information and data are subject to change. Inclusion on this website does not imply or represent a direct relationship with the company, school, or brand. Information, though believed correct at time of publication, may not be correct, and no warranty is provided. Contact the schools to verify any information before relying on it. Financial aid may be available for those who qualify. The displayed options may include sponsored or recommended results, not necessarily based on your preferences.
© TeachingDegreeSearch.com – All Rights Reserved.