Other Teacher Education & Professional Development, Specific Subject Areas
Types of Degrees Other Teacher Education & Professional Development, Specific Subject Areas Majors Are Getting
The following table lists how many other teacher education & professional development, specific subject areas graduations there were for each degree level during the last year for which data was available.
| Education Level | Number of Grads |
|---|---|
| Master’s Degree | 1,261 |
| Associate Degree | 647 |
| Graduate Certificate | 170 |
| Bachelor’s Degree | 132 |
| Undergraduate Certificate | 90 |
| Basic Certificate | 56 |
| Doctor’s Degree | 42 |
Who Is Getting a Bachelor’s Degree in Other Teacher Education & Professional Development, Specific Subject Areas?
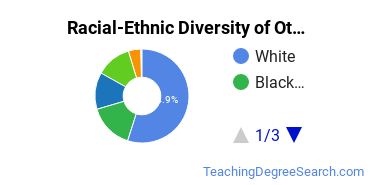
Racial-Ethnic Diversity
At the countrywide level, the racial-ethnic distribution of other teacher education & professional development, specific subject areas majors is as follows:

| Race/Ethnicity | Number of Grads |
|---|---|
| Asian | 2 |
| Black or African American | 28 |
| Hispanic or Latino | 9 |
| White | 85 |
| International Students | 0 |
| Other Races/Ethnicities | 8 |
Online Other Teacher Education & Professional Development, Specific Subject Areas Programs
The following table lists the number of programs by degree level, along with how many schools offered online courses in the field.
| Degree Level | Colleges Offering Programs | Colleges Offering Online Classes |
|---|---|---|
| Certificate (Less Than 1 Year) | 0 | 0 |
| Certificate (1-2 years) | 6 | 1 |
| Certificate (2-4 Years) | 2 | 0 |
| Associate’s Degree | 19 | 1 |
| Bachelor’s Degree | 47 | 14 |
| Post-Baccalaureate | 0 | 0 |
| Master’s Degree | 82 | 18 |
| Post-Master’s | 12 | 0 |
| Doctor’s Degree (Research) | 12 | 0 |
| Doctor’s Degree (Professional Practice) | 2 | 0 |
| Doctor’s Degree (Other) | 0 | 0 |
Explore Major by State
Alabama
California
District of Columbia
Idaho
Kansas
Maryland
Mississippi
Nevada
New York
Oklahoma
South Carolina
Utah
West Virginia
Alaska
Colorado
Florida
Illinois
Kentucky
Massachusetts
Missouri
New Hampshire
North Carolina
Oregon
South Dakota
Vermont
Wisconsin
Majors Related to Other Teacher Education & Professional Development, Specific Subject Areas
You may also be interested in one of the following majors related to other teacher education & professional development, specific subject areas.
References
*The racial-ethnic minorities count is calculated by taking the total number of students and subtracting white students, international students, and students whose race/ethnicity was unknown. This number is then divided by the total number of students at the school to obtain the racial-ethnic minorities percentage.
- College Factual
- College Scorecard
- National Center for Education Statistics
- O*NET Online
- U.S. Bureau of Labor Statistics
- Usual Weekly Earnings of Wage and Salary Workers First Quarter 2020
- Image Credit: By Aparajita Datta under License
More about our data sources and methodologies.
