Social Scientists and Related Workers, All Other in Missouri
Want to work as a Social Scientists and Related Workers, All Other in Missouri? Here’s what the data says. All social scientists and related workers not listed separately.
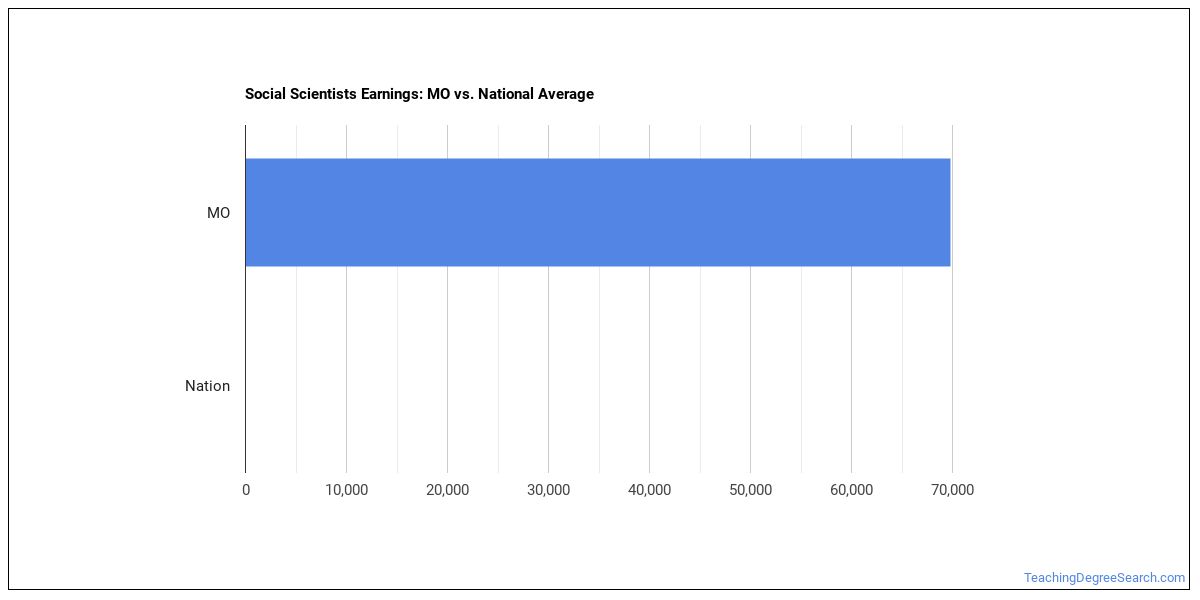
What do Social Scientists and Related Workers, All Other Make in Missouri?
For a social scientists and related workers, all other working in Missouri, the median annual wage is $80,040 per year (or about $38.48/hour).Earnings range from $50,880 at the 10th percentile to $115,520 at the 90th percentile.
| Wage Statistic | Annual | Hourly |
|---|---|---|
| 10th percentile | $50,880 | $24.46 |
| 25th percentile | $63,440 | $30.50 |
| Median (50th) | $80,040 | $38.48 |
| 75th percentile | $92,020 | $44.24 |
| 90th percentile | $115,520 | $55.54 |

The job concentration index in Missouri compared to the national average — is 0.49, indicating fewer social scientists and related workers, all other per worker than the national average.
National Wage Comparison
Nationally, social scientists and related workers, all other earn a median of $42,168 per year ($20.27/hour), above the Missouri median.
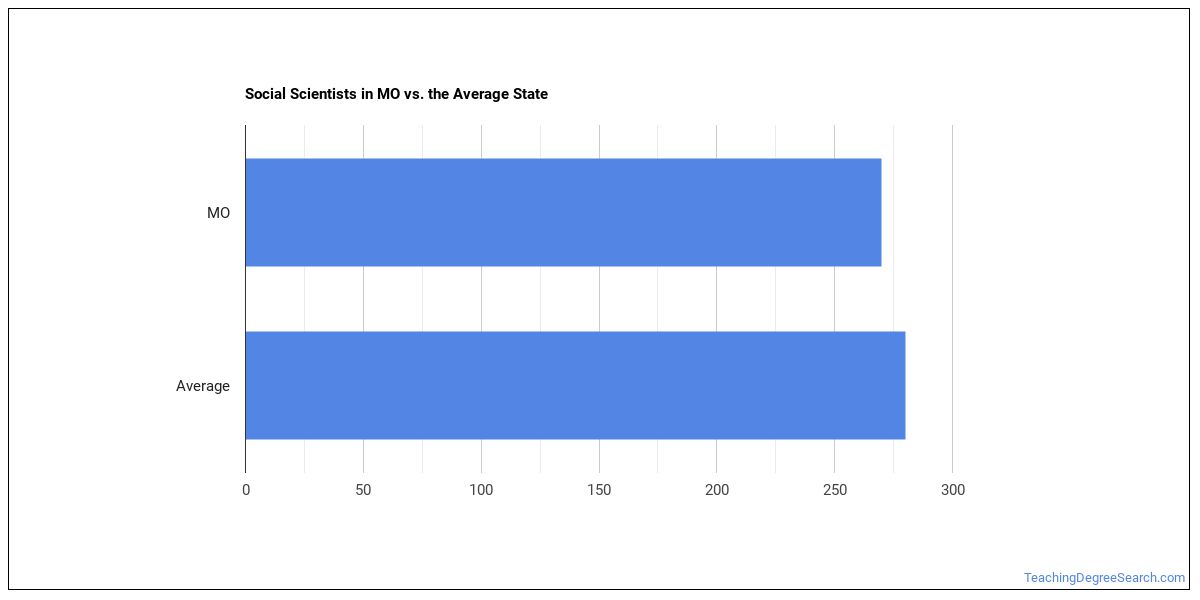
Employment Outlook
Nationally, total employment in this occupation is 23,164 social scientists and related workers, all other in the U.S.. In Missouri alone, about 340 people work in this role. That’s higher than the typical state, which employs around 320 social scientists and related workers, all other.

Top Missouri Metros for Social Scientists and Related Workers, All Other
These are the Missouri metros with the most social scientists and related workers, all other in Missouri.
| Metro Area | Number Employed | Annual Median Salary |
|---|---|---|
| Kansas City, MO-KS | 230 | $88,320 |
| St. Louis, MO-IL | 170 | $89,040 |
| Jefferson City, MO | 60 | $55,420 |
| Springfield, MO | 30 | $80,250 |
Top States for Social Scientists and Related Workers, All Other Employment
The table below shows the states where the most social scientists and related workers, all other work.
| State | Number Employed |
|---|---|
| Virginia | 4,390 |
| New York | 3,090 |
| District of Columbia | 2,700 |
| California | 2,650 |
| Maryland | 2,520 |
| Texas | 2,480 |
| North Carolina | 1,660 |
| Ohio | 1,560 |
| Florida | 1,560 |
| Georgia | 1,330 |
| Washington | 1,070 |
| Minnesota | 910 |
| Colorado | 790 |
| Pennsylvania | 750 |
| Michigan | 720 |
| Arizona | 700 |
| Illinois | 650 |
| Massachusetts | 430 |
| Louisiana | 410 |
| Kentucky | 370 |
Highest-Paying States for Social Scientists and Related Workers, All Other
These states pay the most for social scientists and related workers, all other.
| State | Annual Median Salary |
|---|---|
| Virginia | $144,320 |
| Maryland | $129,750 |
| District of Columbia | $122,320 |
| Washington | $107,100 |
| Massachusetts | $104,770 |
| New York | $102,570 |
| Connecticut | $102,150 |
| Hawaii | $102,000 |
| California | $101,110 |
| Colorado | $101,000 |
What Major Will Prepare You For This Career?
Programs that train for this career include:
- Educational Assessment
Featured schools near , edit
Also Known As
Behavioral Scientist, Computational Linguist, Demographer, Developmental Psychologist, Director of Research, Ethnologist, Etymologist, Experimental Psychologist, Forensic Psychologist, Group Tester, Health Psychologist, Human Factors Scientist, Intelligence Research Specialist, Intelligence Specialist, Jury Consultant.
References
- U.S. Bureau of Labor Statistics, Occupational Employment and Wage Statistics — https://www.bls.gov/oes/
- O*NET Online — https://www.onetonline.org/
- BLS Employment Projections — https://www.bls.gov/emp/
- O*NET-SOC code: 19-3099.00
TeachingDegreeSearch.com provides higher-education, college and university, degree, program, career, salary, and other helpful information to students, faculty, institutions, and other internet audiences. Presented information and data are subject to change. Inclusion on this website does not imply or represent a direct relationship with the company, school, or brand. Information, though believed correct at time of publication, may not be correct, and no warranty is provided. Contact the schools to verify any information before relying on it. Financial aid may be available for those who qualify. The displayed options may include sponsored or recommended results, not necessarily based on your preferences.
© TeachingDegreeSearch.com – All Rights Reserved.