Special Education at Arizona State University Campus Immersion
What traits are you looking for in a school for Special Education, you may want to check out the program at Arizona State University Campus Immersion. We’ve gathered the following information to help you decide.
Arizona State University Campus Immersion sits in Tempe, AZ.
For the most recent IPEDS reporting year, 128 special education graduations were recorded at Arizona State University Campus Immersion.
Featured schools near , edit
Studying Online at Arizona State University Campus Immersion
Distance learning is available at Arizona State University Campus Immersion. Of 79,818 students, 3,837 (5%) were enrolled entirely in distance education and 42,409 (53%) took at least some classes online.
Special Education Rankings at Arizona State University Campus Immersion
Rankings can help you compare Arizona State University Campus Immersion’s Special Education program against peer institutions.
Bachelor’s-Level Rankings
| Ranking | Scope | Rank |
|---|---|---|
| Best Schools (Quality) | Arizona | #1 of 7 |
| Best Value | Arizona | #2 of 6 |
| Best Schools (Quality) | Southwest (Region) | #3 of 37 |
| Best Value | Southwest (Region) | #17 of 36 |
| Best Schools (Quality) | Nationwide | #63 of 491 |
| Best Value | Nationwide | #107 of 486 |
Master’s-Level Rankings
| Ranking | Scope | Rank |
|---|---|---|
| Best Schools (Quality) | Arizona | #1 of 7 |
| Best Value | Arizona | #2 of 6 |
| Best Schools (Quality) | Southwest (Region) | #3 of 37 |
| Best Value | Southwest (Region) | #17 of 36 |
| Best Schools (Quality) | Nationwide | #63 of 491 |
| Best Value | Nationwide | #107 of 486 |
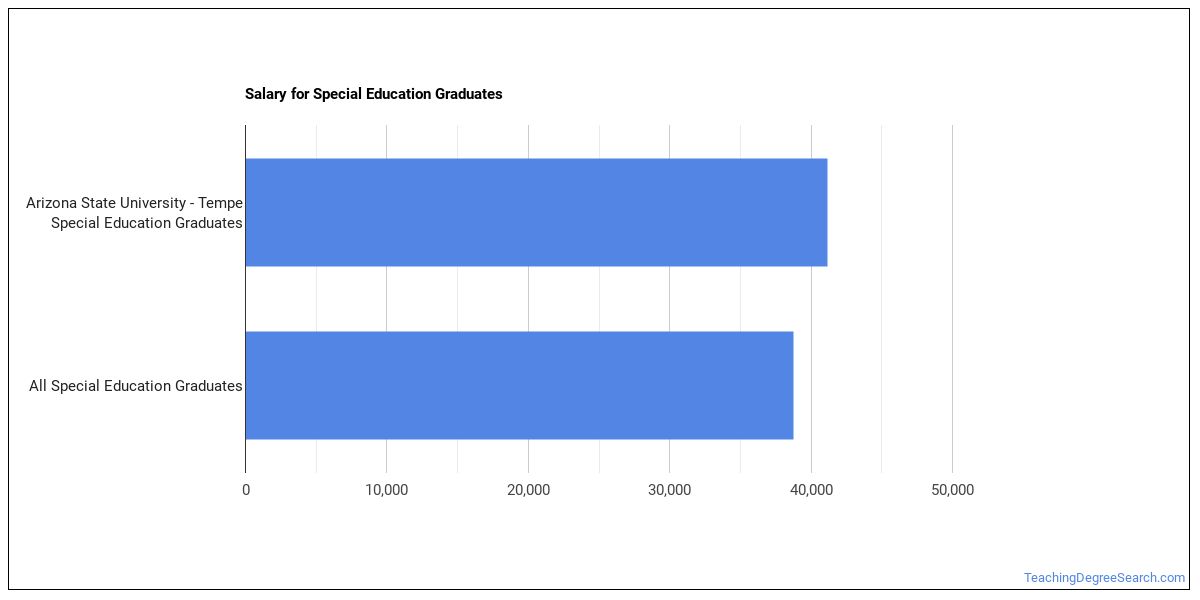
Earnings for Special Education Graduates from Arizona State University Campus Immersion
Students who complete Arizona State University Campus Immersion’s Special Education program earn the following amounts (per the U.S. Department of Education’s College Scorecard):
| Years After Graduation | Median Earnings |
|---|---|
| 1 year | $42,274 |
| 2 years | $40,799 |
| 3 years | $42,975 |
| 4 years | $48,422 |
| 5 years | $54,452 |
Is this above or below average for the school? Four years after graduating, Special Education graduates from Arizona State University Campus Immersion report median earnings of $48,422, compared with $72,410 for all Arizona State University Campus Immersion graduates — about 33% lower than the school-wide median.

Median Debt at Graduation
The median debt for Special Education graduates from Arizona State University Campus Immersion comes in at $19,375.
Student Demographics & Diversity
Take a look at the student demographics for Special Education graduates at Arizona State University Campus Immersion, broken down by degree level.
Program-wide, Special Education graduates at Arizona State University Campus Immersion are 92% women (118) and 8% men (10).
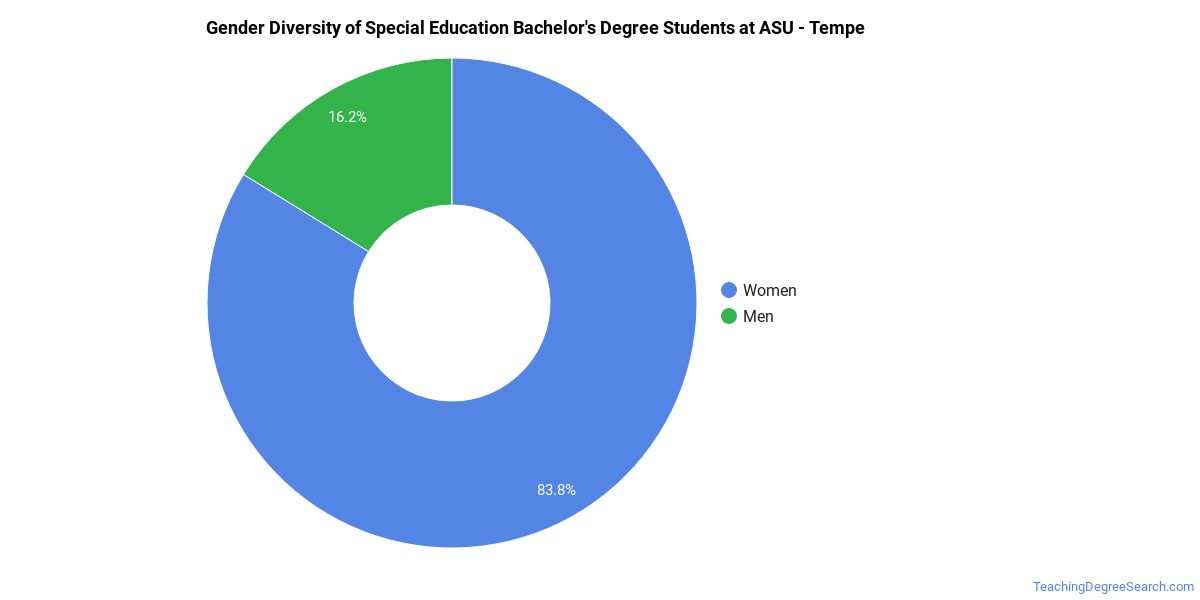
Special Education Bachelor’s Program at Arizona State University Campus Immersion
Among the 60 bachelor’s special education graduates at Arizona State University Campus Immersion, 92% were women (55) and 8% were men (5).
The following table and chart show the race/ethnicity of Special Education bachelor’s degree recipients at Arizona State University Campus Immersion.
| Race / Ethnicity | Number of Graduates |
|---|---|
| White | 31 |
| Hispanic / Latino | 20 |
| Black / African American | 3 |
| American Indian / Alaska Native | 1 |
| Two or More Races | 4 |
| International (Nonresident) | 1 |
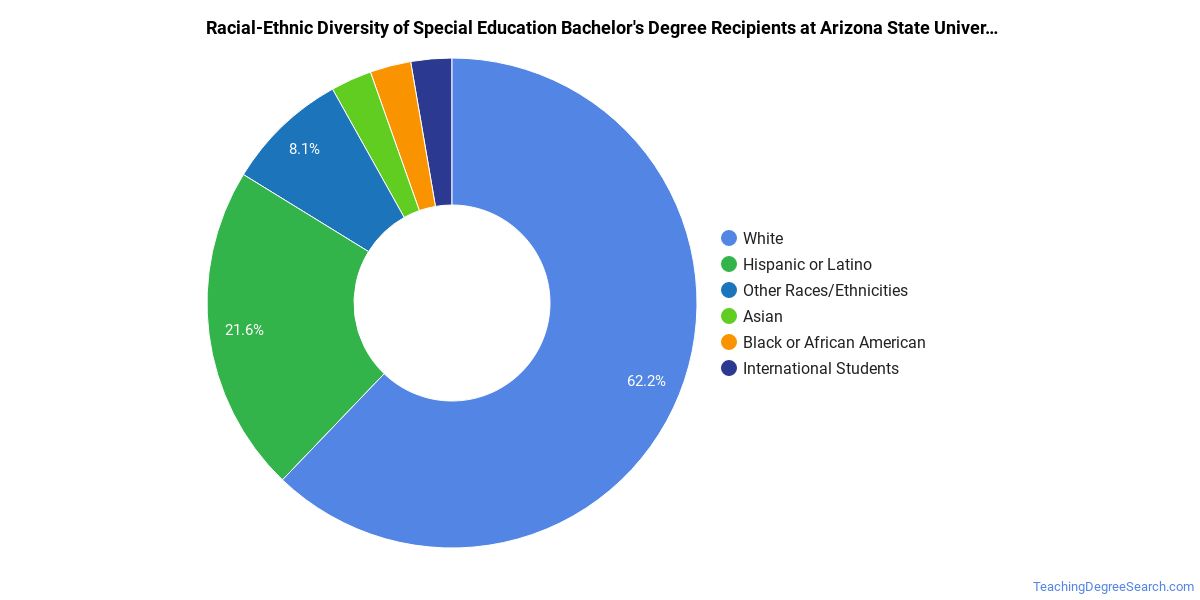
Racial-ethnic minorities make up 47% of Special Education bachelor’s degree recipients at Arizona State University Campus Immersion, above the national average of 20%.*
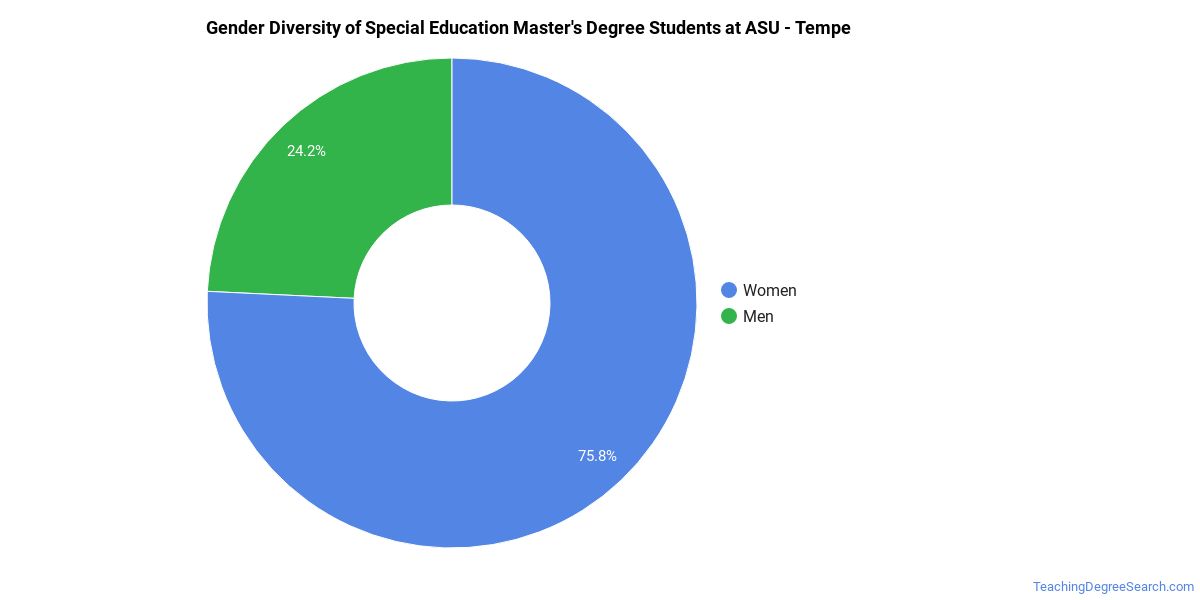
Special Education Master’s Program at Arizona State University Campus Immersion
Of the 23 master’s special education degrees awarded at Arizona State University Campus Immersion, 83% were women (19) and 17% were men (4).
The following table and chart show the race/ethnicity of Special Education master’s degree recipients at Arizona State University Campus Immersion.
| Race / Ethnicity | Number of Graduates |
|---|---|
| White | 18 |
| Hispanic / Latino | 2 |
| Black / African American | 2 |
| Asian | 1 |
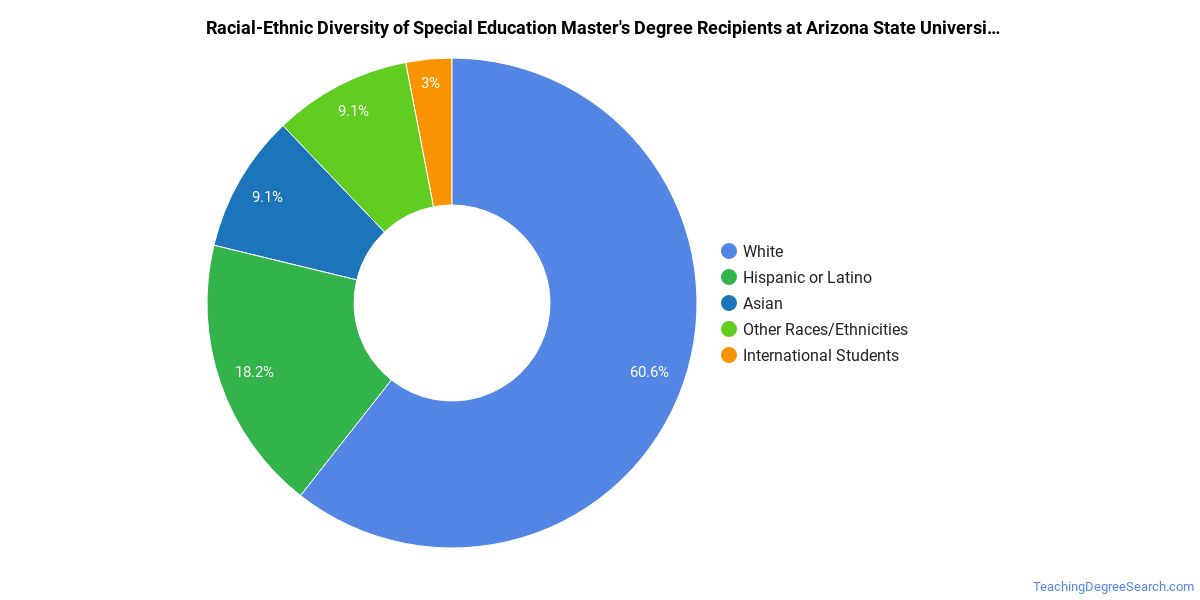
Minority students account for 22% of Special Education master’s degree recipients at Arizona State University Campus Immersion, lower than the national average of 33%.*
*The racial-ethnic minorities figure is the total number of graduates minus White, international (nonresident), and unknown-race graduates.
More Specific Special Education Concentrations at Arizona State University Campus Immersion
The Special Education program at Arizona State University Campus Immersion offers more specialized concentrations:
| Concentration | Graduates |
|---|---|
| General Special Education | 107 |
| Early Childhood Special Education | 21 |
Top-Paying Careers for Special Education Graduates
Students who finish Special Education program at Arizona State University Campus Immersion work across a variety of fields. Here are the top-paying careers for Special Education majors, ordered by median annual salary:
| Occupation | Nationwide Median Wage |
|---|---|
| Education Teachers, Postsecondary | $98,329 |
| Teaching Assistants, Special Education | $96,801 |
| Special Education Teachers, All Other | $86,208 |
| Special Education Teachers, Middle School | $80,694 |
| Special Education Teachers, Secondary School | $79,680 |
| Adapted Physical Education Specialists | $77,976 |
| Special Education Teachers, Kindergarten | $73,597 |
| Interpreters and Translators | $52,627 |
| Special Education Teachers, Elementary School | $50,045 |
| Special Education Teachers, Preschool | $35,173 |
References
- IPEDS — Integrated Postsecondary Education Data System
- U.S. Department of Education — College Scorecard
- O*NET Online (Bureau of Labor Statistics)
- National Center for Education Statistics
More about our data sources and methodologies.
TeachingDegreeSearch.com provides higher-education, college and university, degree, program, career, salary, and other helpful information to students, faculty, institutions, and other internet audiences. Presented information and data are subject to change. Inclusion on this website does not imply or represent a direct relationship with the company, school, or brand. Information, though believed correct at time of publication, may not be correct, and no warranty is provided. Contact the schools to verify any information before relying on it. Financial aid may be available for those who qualify. The displayed options may include sponsored or recommended results, not necessarily based on your preferences.
© TeachingDegreeSearch.com – All Rights Reserved.