Higher Education Administration at Boston College
If you plan to study Higher Education Administration, consider the program at Boston College. The following information will help you decide if it is a good fit for you.
Boston College is located in Chestnut Hill, MA.
During the most recent reporting year, 56 higher education administration degrees were granted at Boston College.
Featured schools near , edit
Online Class Availability at Boston College
Online coursework is an option at Boston College. Of 15,432 students, 732 (5%) were enrolled entirely in distance education and 2,039 (13%) took at least some classes online.
Higher Education Administration Rankings at Boston College
These rankings give you a sense of how Boston College’s Higher Education Administration program against peer institutions.
Master’s-Level Rankings
| Ranking | Scope | Rank |
|---|---|---|
| Best Schools (Quality) | Massachusetts | #1 of 5 |
| Best Schools (Quality) | New England (Region) | #1 of 10 |
| Best Schools (Quality) | Nationwide | #5 of 128 |
| Best Value | Massachusetts | #5 of 5 |
| Best Value | New England (Region) | #14 of 16 |
| Best Value | Nationwide | #216 of 225 |
Doctoral-Level Rankings
| Ranking | Scope | Rank |
|---|---|---|
| Best Schools (Quality) | Massachusetts | #1 of 5 |
| Best Schools (Quality) | New England (Region) | #1 of 10 |
| Best Schools (Quality) | Nationwide | #5 of 128 |
| Best Value | Massachusetts | #5 of 5 |
| Best Value | New England (Region) | #14 of 16 |
| Best Value | Nationwide | #216 of 225 |
Student Demographics & Diversity
The following sections describe the diversity of Higher Education Administration graduates at Boston College, broken down by degree level.
Program-wide, Higher Education Administration graduates at Boston College are 64% women (36) and 36% men (20).
Higher Education Administration Master’s Program at Boston College
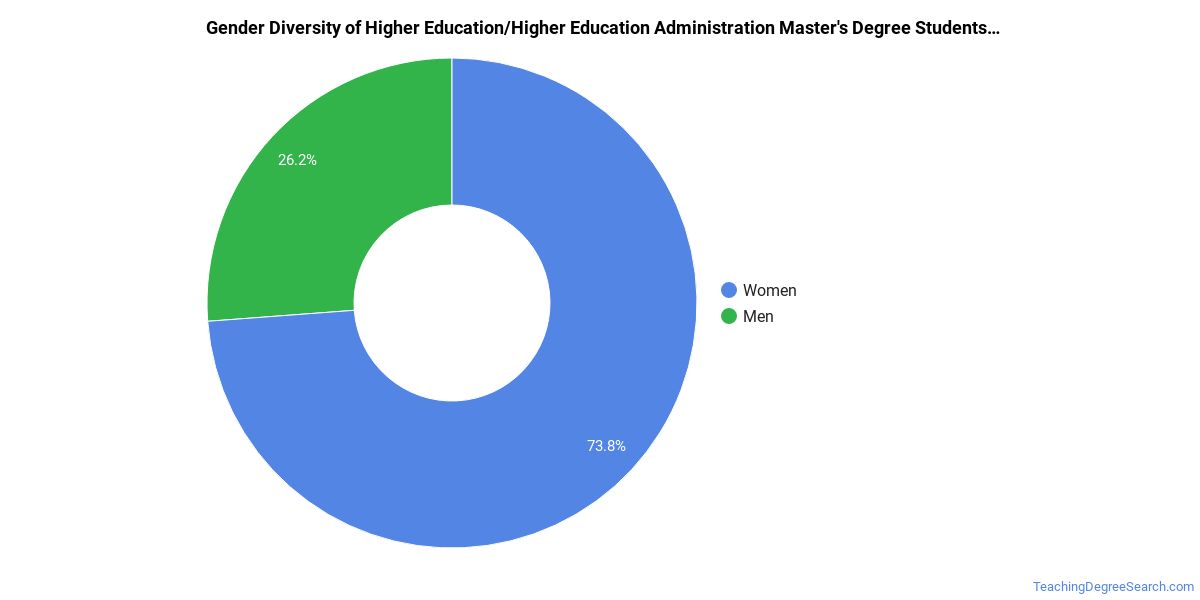
Among the 34 master’s higher education administration degrees awarded at Boston College, 65% were women (22) and 35% were men (12).
The following table and chart show the race/ethnicity of Higher Education Administration master’s degree recipients at Boston College.
| Race / Ethnicity | Number of Graduates |
|---|---|
| White | 21 |
| Hispanic / Latino | 3 |
| Black / African American | 4 |
| Asian | 4 |
| Two or More Races | 2 |
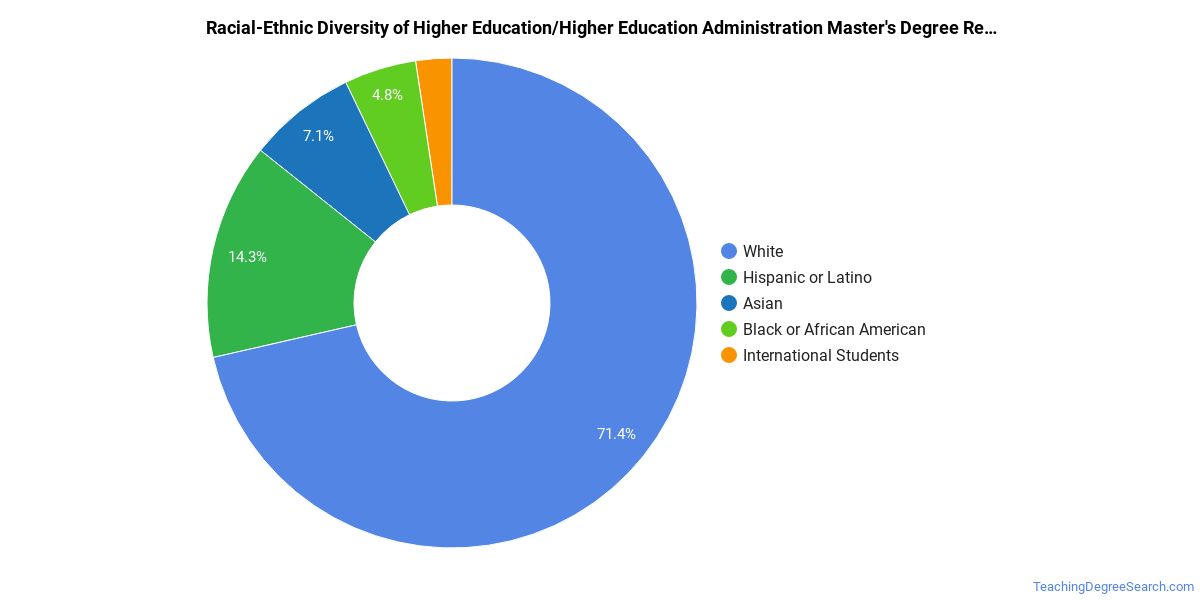
Racial-ethnic minorities make up 38% of Higher Education Administration master’s degree recipients at Boston College, below the national average of 45%.*
Higher Education Administration Doctoral Program at Boston College
Among the 22 doctoral higher education administration degrees awarded at Boston College, 64% were women (14) and 36% were men (8).

The following table and chart show the race/ethnicity of Higher Education Administration doctoral degree recipients at Boston College.
| Race / Ethnicity | Number of Graduates |
|---|---|
| White | 11 |
| Hispanic / Latino | 2 |
| Black / African American | 3 |
| Asian | 2 |
| Two or More Races | 1 |
| International (Nonresident) | 3 |

Racial-ethnic minorities make up 36% of Higher Education Administration doctoral degree recipients at Boston College, below the national average of 43%.*
*The racial-ethnic minorities figure is the total number of graduates minus White, international (nonresident), and unknown-race graduates.
Top-Paying Careers for Higher Education Administration Graduates
Graduates of the Higher Education Administration program at Boston College go on to a range of careers. Below are the top-paying careers for Higher Education Administration graduates, ordered by median annual salary:
| Occupation | Nationwide Median Wage |
|---|---|
| Education Administrators, Postsecondary | $161,927 |
| Education Administrators, All Other | $91,340 |
References
- IPEDS — Integrated Postsecondary Education Data System
- U.S. Department of Education — College Scorecard
- O*NET Online (Bureau of Labor Statistics)
- National Center for Education Statistics
More about our data sources and methodologies.
TeachingDegreeSearch.com provides higher-education, college and university, degree, program, career, salary, and other helpful information to students, faculty, institutions, and other internet audiences. Presented information and data are subject to change. Inclusion on this website does not imply or represent a direct relationship with the company, school, or brand. Information, though believed correct at time of publication, may not be correct, and no warranty is provided. Contact the schools to verify any information before relying on it. Financial aid may be available for those who qualify. The displayed options may include sponsored or recommended results, not necessarily based on your preferences.
© TeachingDegreeSearch.com – All Rights Reserved.