Teacher Education Grade Specific at Chestnut Hill College
What traits are you looking for in a school for Teacher Education Grade Specific, consider the program at Chestnut Hill College. We’ve gathered the following information to help you decide.
Chestnut Hill College sits in Philadelphia, PA.
For the most recent IPEDS reporting year, 46 teacher education grade specific degrees were awarded at Chestnut Hill College.
Featured schools near , edit
Studying Online at Chestnut Hill College
Distance learning is available at Chestnut Hill College. Of 1,288 students, 142 (11%) studied exclusively online and 199 (15%) took at least some classes online.
Teacher Education Grade Specific Rankings at Chestnut Hill College
Use these rankings to compare Chestnut Hill College’s Teacher Education Grade Specific program against peer institutions.
Bachelor’s-Level Rankings
| Ranking | Scope | Rank |
|---|---|---|
| Best Schools (Quality) | Pennsylvania | #48 of 73 |
| Best Value | Pennsylvania | #62 of 73 |
| Best Schools (Quality) | Middle Atlantic (Region) | #149 of 188 |
| Best Value | Middle Atlantic (Region) | #165 of 189 |
| Best Schools (Quality) | Nationwide | #759 of 1,231 |
| Best Value | Nationwide | #1144 of 1,224 |
Master’s-Level Rankings
| Ranking | Scope | Rank |
|---|---|---|
| Best Schools (Quality) | Pennsylvania | #48 of 73 |
| Best Value | Pennsylvania | #62 of 73 |
| Best Schools (Quality) | Middle Atlantic (Region) | #149 of 188 |
| Best Value | Middle Atlantic (Region) | #165 of 189 |
| Best Schools (Quality) | Nationwide | #759 of 1,231 |
| Best Value | Nationwide | #1144 of 1,224 |
Earnings for Teacher Education Grade Specific Graduates from Chestnut Hill College
Graduates of Chestnut Hill College’s Teacher Education Grade Specific program report the following median earnings (per the U.S. Department of Education’s College Scorecard):
| Years After Graduation | Median Earnings |
|---|---|
| 1 year | $43,924 |
| 2 years | $37,446 |
| 3 years | $44,709 |
| 4 years | $46,130 |
| 5 years | $53,759 |
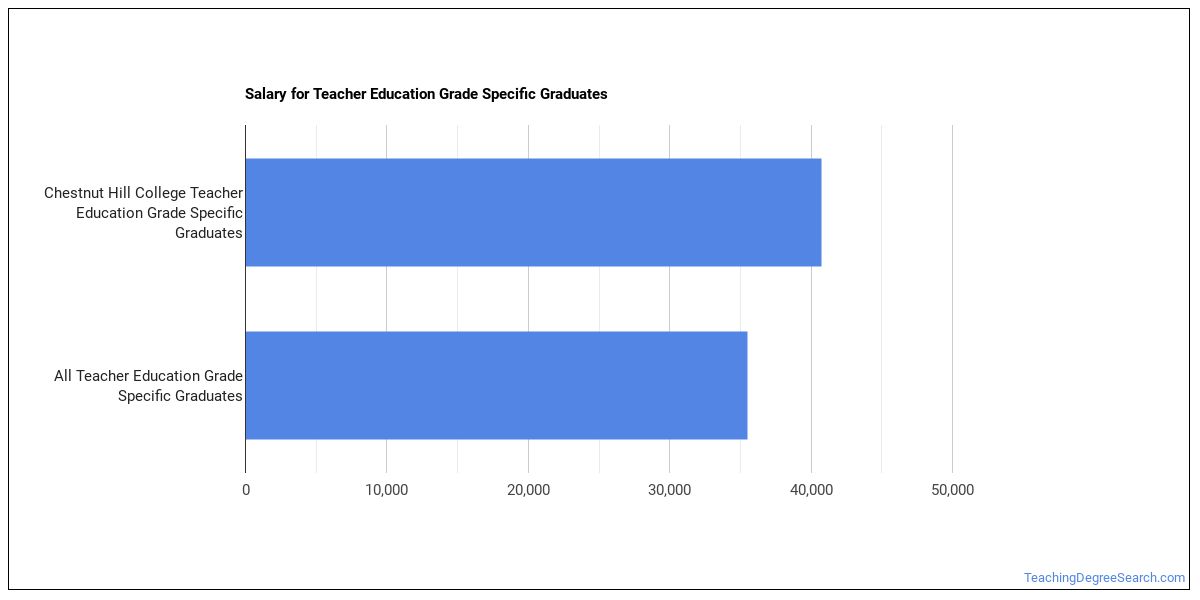
Is this above or below average for the school? At the four-year mark, Teacher Education Grade Specific graduates from Chestnut Hill College report median earnings of $46,130, compared with $50,184 for all Chestnut Hill College graduates — about 8% lower than the school-wide median.

Median Debt at Graduation
The median debt for Teacher Education Grade Specific graduates from Chestnut Hill College is $27,000.
Student Demographics & Diversity
Below you’ll find the student demographics for Teacher Education Grade Specific graduates at Chestnut Hill College, by degree type.
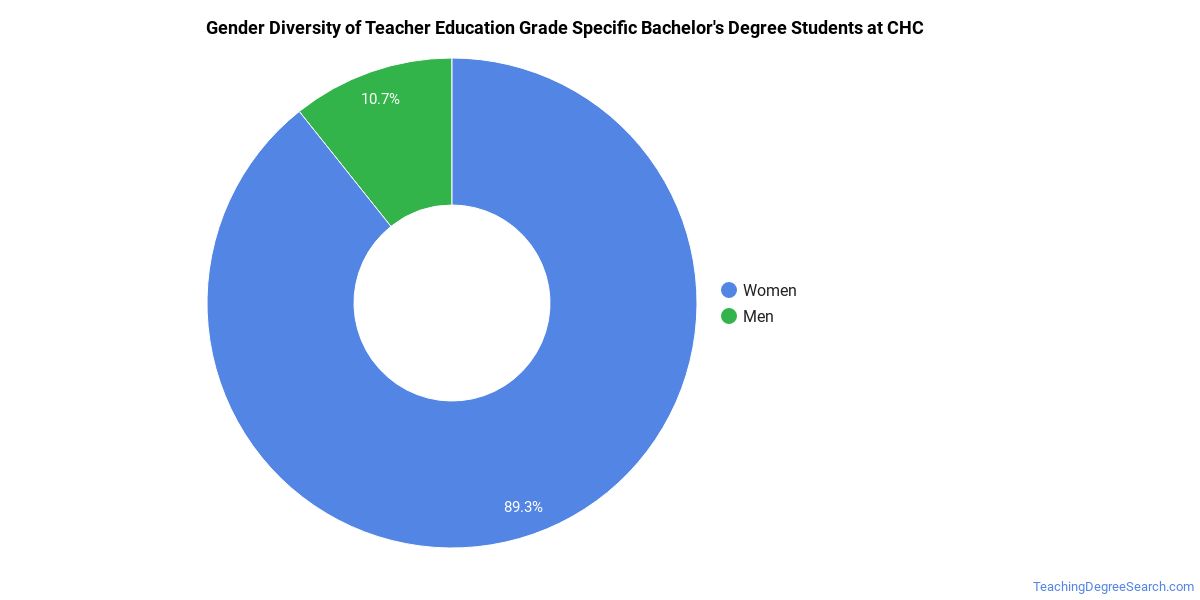
Program-wide, Teacher Education Grade Specific graduates at Chestnut Hill College are 89% women (41) and 11% men (5).
Teacher Education Grade Specific Bachelor’s Program at Chestnut Hill College
Among the 32 bachelor’s teacher education grade specific graduates at Chestnut Hill College, 94% were women (30) and 6% were men (2).
The following table and chart show the race/ethnicity of Teacher Education Grade Specific bachelor’s degree recipients at Chestnut Hill College.
| Race / Ethnicity | Number of Graduates |
|---|---|
| White | 12 |
| Hispanic / Latino | 1 |
| Black / African American | 9 |
| Asian | 1 |
| Unknown | 9 |
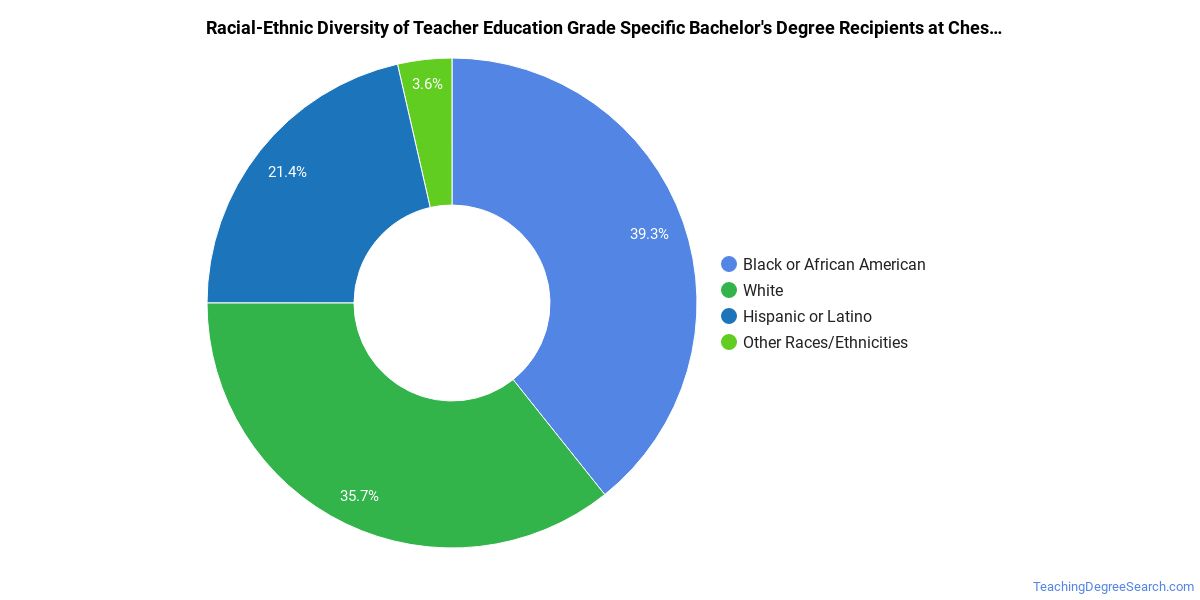
Minority students account for 34% of Teacher Education Grade Specific bachelor’s degree recipients at Chestnut Hill College, above the national average of 29%.*
Teacher Education Grade Specific Master’s Program at Chestnut Hill College
Of the 14 master’s teacher education grade specific degrees awarded at Chestnut Hill College, 79% were women (11) and 21% were men (3).

The following table and chart show the race/ethnicity of Teacher Education Grade Specific master’s degree recipients at Chestnut Hill College.
| Race / Ethnicity | Number of Graduates |
|---|---|
| White | 8 |
| Black / African American | 1 |
| Asian | 1 |
| Unknown | 4 |

Minority students account for 14% of Teacher Education Grade Specific master’s degree recipients at Chestnut Hill College, lower than the national average of 32%.*
*The racial-ethnic minorities figure is the total number of graduates minus White, international (nonresident), and unknown-race graduates.
More Specific Teacher Education Grade Specific Concentrations at Chestnut Hill College
The Teacher Education Grade Specific program at Chestnut Hill College includes the following sub-specializations:
| Concentration | Graduates |
|---|---|
| Secondary Education | 9 |
| Montessori Teacher Education | 8 |
| Early Childhood Education | 29 |
Highest-Paying Careers for Teacher Education Grade Specific Graduates
Students who finish Teacher Education Grade Specific program at Chestnut Hill College go on to a range of careers. The table below ranks the best-paid careers for Teacher Education Grade Specific graduates, ordered by median annual salary:
References
- IPEDS — Integrated Postsecondary Education Data System
- U.S. Department of Education — College Scorecard
- O*NET Online (Bureau of Labor Statistics)
- National Center for Education Statistics
More about our data sources and methodologies.
TeachingDegreeSearch.com provides higher-education, college and university, degree, program, career, salary, and other helpful information to students, faculty, institutions, and other internet audiences. Presented information and data are subject to change. Inclusion on this website does not imply or represent a direct relationship with the company, school, or brand. Information, though believed correct at time of publication, may not be correct, and no warranty is provided. Contact the schools to verify any information before relying on it. Financial aid may be available for those who qualify. The displayed options may include sponsored or recommended results, not necessarily based on your preferences.
© TeachingDegreeSearch.com – All Rights Reserved.