General Educational Leadership at Fielding Graduate University
If you are interested in studying General Educational Leadership, consider the program at Fielding Graduate University. We’ve gathered the following information to help you decide.
Fielding Graduate University sits in Santa Barbara, CA.
For the most recent IPEDS reporting year, 25 general educational leadership degrees were awarded at Fielding Graduate University.
Featured schools near , edit
Studying Online at Fielding Graduate University
Online coursework is an option at Fielding Graduate University. Among 915 students, 606 (66%) were enrolled entirely in distance education and 309 (34%) took at least some classes online.
General Educational Leadership Rankings at Fielding Graduate University
Use these rankings to compare Fielding Graduate University’s General Educational Leadership program against other schools offering the same major.
Doctoral-Level Rankings
| Ranking | Scope | Rank |
|---|---|---|
| Best Schools (Quality) | California | #None of 35 |
| Best Schools (Quality) | Far Western (Region) | #None of 50 |
| Best Schools (Quality) | Nationwide | #None of 499 |
| Best Value | California | #None of 37 |
| Best Value | Far Western (Region) | #None of 53 |
| Best Value | Nationwide | #None of 531 |
Student Demographics & Diversity
Below you’ll find the diversity of General Educational Leadership graduates at Fielding Graduate University, broken down by degree level.
Across all degree levels, General Educational Leadership graduates at Fielding Graduate University are 76% women (19) and 24% men (6).
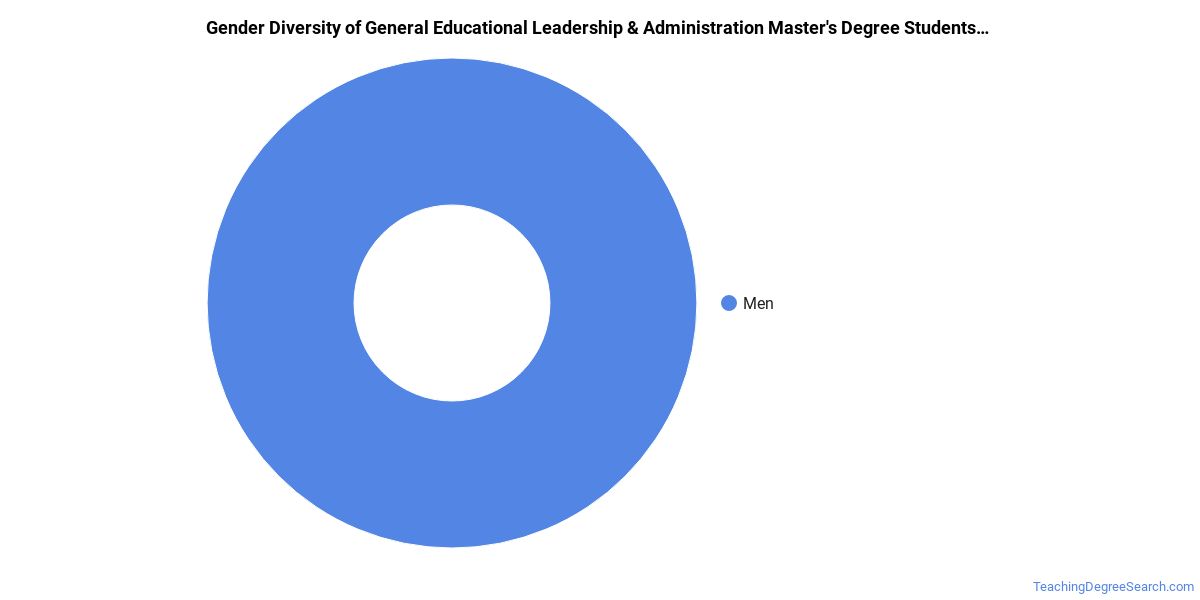
General Educational Leadership Master’s Program at Fielding Graduate University
Among the 12 master’s general educational leadership graduates at Fielding Graduate University, 67% were women (8) and 33% were men (4).
The following table and chart show the race/ethnicity of General Educational Leadership master’s degree recipients at Fielding Graduate University.
| Race / Ethnicity | Number of Graduates |
|---|---|
| White | 2 |
| Hispanic / Latino | 1 |
| Black / African American | 4 |
| American Indian / Alaska Native | 3 |
| Two or More Races | 2 |

Racial-ethnic minorities make up 83% of General Educational Leadership master’s degree recipients at Fielding Graduate University, above the national average of 33%.*
General Educational Leadership Doctoral Program at Fielding Graduate University
Of the 13 doctoral general educational leadership graduates at Fielding Graduate University, 85% were women (11) and 15% were men (2).

The following table and chart show the race/ethnicity of General Educational Leadership doctoral degree recipients at Fielding Graduate University.
| Race / Ethnicity | Number of Graduates |
|---|---|
| White | 5 |
| Hispanic / Latino | 2 |
| Black / African American | 2 |
| Asian | 1 |
| American Indian / Alaska Native | 1 |
| Two or More Races | 1 |
| Unknown | 1 |

Minority students account for 54% of General Educational Leadership doctoral degree recipients at Fielding Graduate University, higher than the national average of 43%.*
*The racial-ethnic minorities figure is the total number of graduates minus White, international (nonresident), and unknown-race graduates.
Best-Paid Careers for General Educational Leadership Graduates
Students who finish General Educational Leadership program at Fielding Graduate University go on to a range of careers. Here are the top-paying careers for General Educational Leadership majors, ordered by median annual salary:
| Occupation | Nationwide Median Wage |
|---|---|
| Education and Childcare Administrators, Preschool and Daycare | $178,795 |
| Education Administrators, Postsecondary | $161,927 |
| Education Administrators, Kindergarten through Secondary | $129,049 |
| Education Administrators, All Other | $91,340 |
References
- IPEDS — Integrated Postsecondary Education Data System
- U.S. Department of Education — College Scorecard
- O*NET Online (Bureau of Labor Statistics)
- National Center for Education Statistics
More about our data sources and methodologies.
TeachingDegreeSearch.com provides higher-education, college and university, degree, program, career, salary, and other helpful information to students, faculty, institutions, and other internet audiences. Presented information and data are subject to change. Inclusion on this website does not imply or represent a direct relationship with the company, school, or brand. Information, though believed correct at time of publication, may not be correct, and no warranty is provided. Contact the schools to verify any information before relying on it. Financial aid may be available for those who qualify. The displayed options may include sponsored or recommended results, not necessarily based on your preferences.
© TeachingDegreeSearch.com – All Rights Reserved.