Special Education at Hope College
What traits are you looking for in a school for Special Education, take a look at what Hope College. The following information will help you decide if it is a good fit for you.
Hope College is in Holland, MI.
In the most recent year for which we have data, 21 special education degrees were awarded at Hope College.
Featured schools near , edit
Online & Distance Learning at Hope College
Many students take online classes at Hope College. Of 3,395 students, 0 (0%) studied exclusively online and 349 (10%) took at least some classes online.
Special Education Rankings at Hope College
Use these rankings to compare Hope College’s Special Education program against other schools offering the same major.
Bachelor’s-Level Rankings
| Ranking | Scope | Rank |
|---|---|---|
| Best Schools (Quality) | Michigan | #2 of 12 |
| Best Value | Michigan | #12 of 12 |
| Best Schools (Quality) | Great Lakes (Region) | #17 of 73 |
| Best Value | Great Lakes (Region) | #66 of 73 |
| Best Schools (Quality) | Nationwide | #119 of 491 |
| Best Value | Nationwide | #404 of 486 |
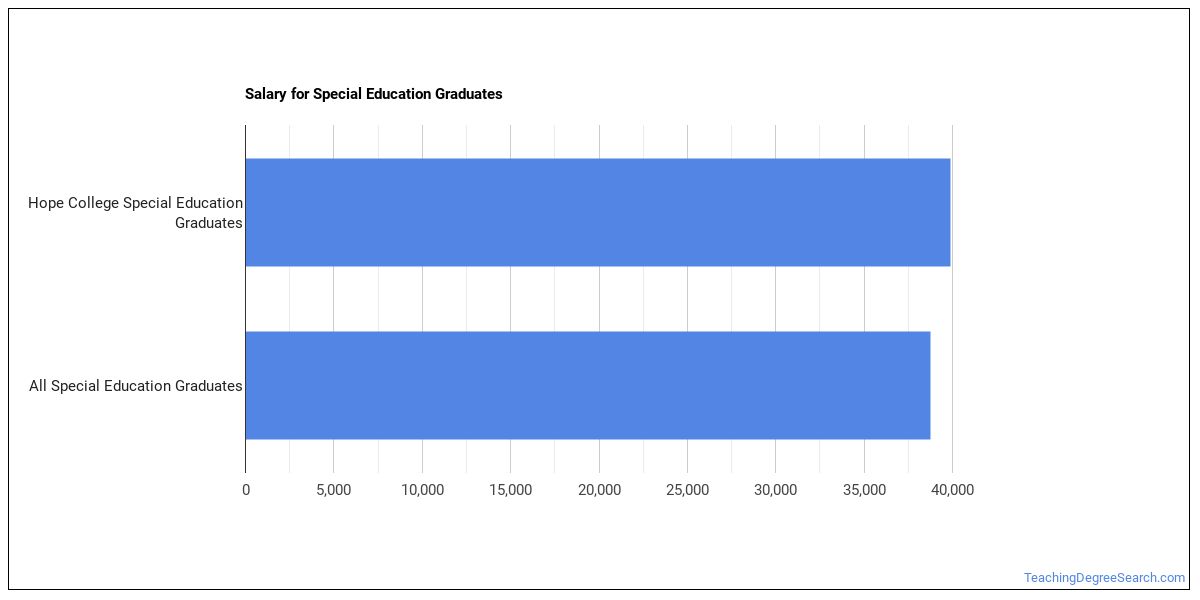
Earnings for Special Education Graduates from Hope College
Students who complete Hope College’s Special Education program earn at the following median levels (per the U.S. Department of Education’s College Scorecard):
| Years After Graduation | Median Earnings |
|---|---|
| 1 year | $39,887 |
| 2 years | $40,768 |
| 3 years | $43,511 |
| 5 years | $50,640 |
Student Demographics & Diversity
Take a look at the student demographics for Special Education graduates at Hope College, broken down by degree level.
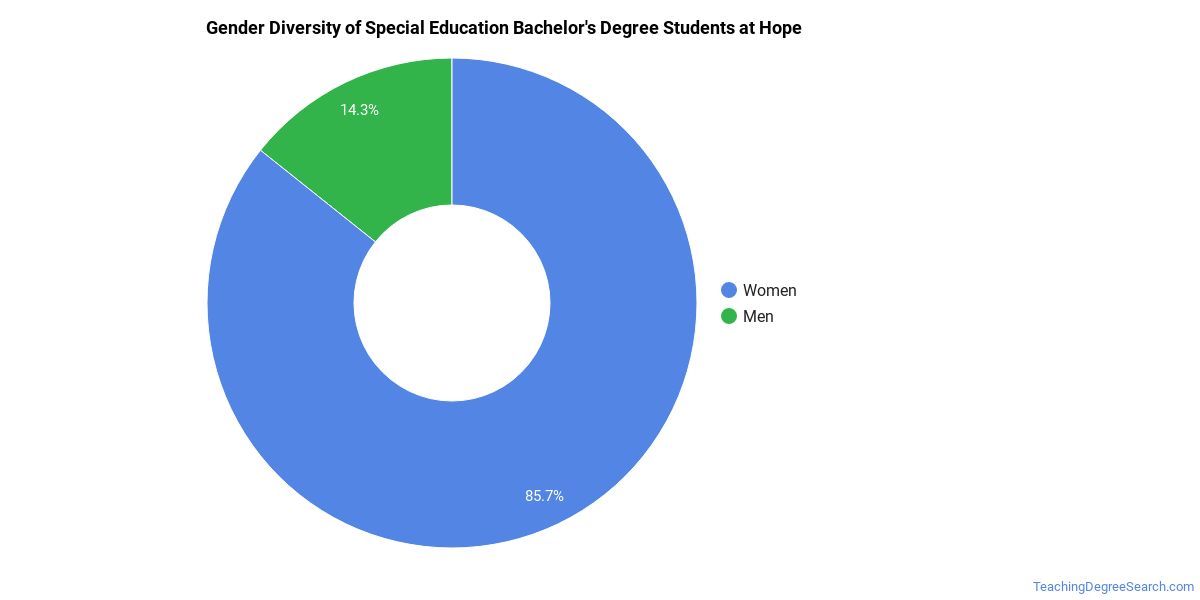
Program-wide, Special Education graduates at Hope College are 71% women (15) and 29% men (6).
Special Education Bachelor’s Program at Hope College
Of the 21 bachelor’s special education graduates at Hope College, 71% were women (15) and 29% were men (6).
The following table and chart show the race/ethnicity of Special Education bachelor’s degree recipients at Hope College.
| Race / Ethnicity | Number of Graduates |
|---|---|
| White | 18 |
| Hispanic / Latino | 3 |
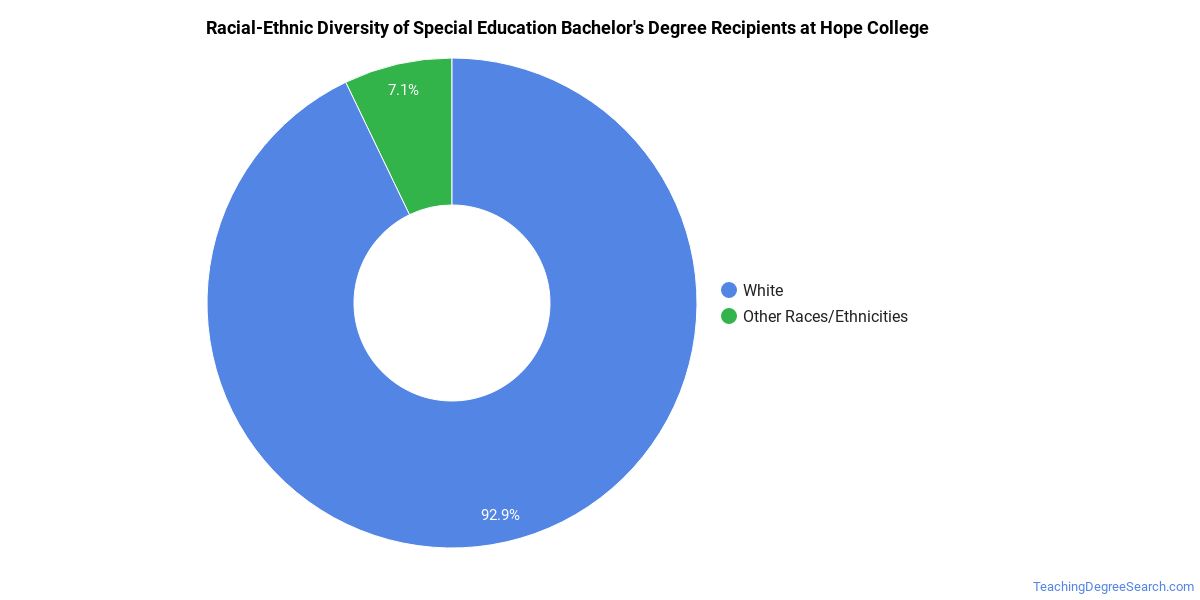
Racial-ethnic minorities make up 14% of Special Education bachelor’s degree recipients at Hope College, lower than the national average of 20%.*
*The racial-ethnic minorities figure is the total number of graduates minus White, international (nonresident), and unknown-race graduates.
More Specific Special Education Concentrations at Hope College
This Special Education program at Hope College includes the following sub-specializations:
| Concentration | Graduates |
|---|---|
| Teaching for Emotional Disturbances | 6 |
| Teaching for Learning Disabilities | 15 |
Best-Paid Careers for Special Education Graduates
Those who complete Special Education program at Hope College go on to a range of careers. The table below ranks the best-paid careers for Special Education graduates, ordered by median annual salary:
| Occupation | Nationwide Median Wage |
|---|---|
| Education Teachers, Postsecondary | $98,329 |
| Teaching Assistants, Special Education | $96,801 |
| Special Education Teachers, All Other | $86,208 |
| Special Education Teachers, Middle School | $80,694 |
| Special Education Teachers, Secondary School | $79,680 |
| Adapted Physical Education Specialists | $77,976 |
| Special Education Teachers, Kindergarten | $73,597 |
| Interpreters and Translators | $52,627 |
| Special Education Teachers, Elementary School | $50,045 |
| Special Education Teachers, Preschool | $35,173 |
References
- IPEDS — Integrated Postsecondary Education Data System
- U.S. Department of Education — College Scorecard
- O*NET Online (Bureau of Labor Statistics)
- National Center for Education Statistics
More about our data sources and methodologies.
TeachingDegreeSearch.com provides higher-education, college and university, degree, program, career, salary, and other helpful information to students, faculty, institutions, and other internet audiences. Presented information and data are subject to change. Inclusion on this website does not imply or represent a direct relationship with the company, school, or brand. Information, though believed correct at time of publication, may not be correct, and no warranty is provided. Contact the schools to verify any information before relying on it. Financial aid may be available for those who qualify. The displayed options may include sponsored or recommended results, not necessarily based on your preferences.
© TeachingDegreeSearch.com – All Rights Reserved.