Teacher Education Subject Specific at Lindenwood University
If you plan to study Teacher Education Subject Specific, take a look at what Lindenwood University. The following information will help you decide if it is a good fit for you.
Lindenwood University is located in Saint Charles, MO.
In the most recent year for which we have data, 23 teacher education subject specific degrees were granted at Lindenwood University.
Featured schools near , edit
Online & Distance Learning at Lindenwood University
Many students take online classes at Lindenwood University. Among 6,826 students, 3,177 (47%) studied exclusively online and 2,994 (44%) took at least some classes online.
Teacher Education Subject Specific Rankings at Lindenwood University
These rankings give you a sense of how Lindenwood University’s Teacher Education Subject Specific program against other schools offering the same major.
Bachelor’s-Level Rankings
| Ranking | Scope | Rank |
|---|---|---|
| Best Value | Missouri | #20 of 26 |
| Best Schools (Quality) | Missouri | #22 of 26 |
| Best Value | The Plains States (Region) | #58 of 88 |
| Best Schools (Quality) | The Plains States (Region) | #85 of 89 |
| Best Value | Nationwide | #353 of 566 |
| Best Schools (Quality) | Nationwide | #530 of 571 |
Master’s-Level Rankings
| Ranking | Scope | Rank |
|---|---|---|
| Best Value | Missouri | #20 of 26 |
| Best Schools (Quality) | Missouri | #22 of 26 |
| Best Value | The Plains States (Region) | #58 of 88 |
| Best Schools (Quality) | The Plains States (Region) | #85 of 89 |
| Best Value | Nationwide | #353 of 566 |
| Best Schools (Quality) | Nationwide | #530 of 571 |
Median Debt at Graduation
Median student loan debt for Teacher Education Subject Specific graduates from Lindenwood University is $32,500.
Student Demographics & Diversity
Take a look at the diversity of Teacher Education Subject Specific graduates at Lindenwood University, broken down by degree level.
Looking at the program as a whole, Teacher Education Subject Specific graduates at Lindenwood University are 74% women (17) and 26% men (6).
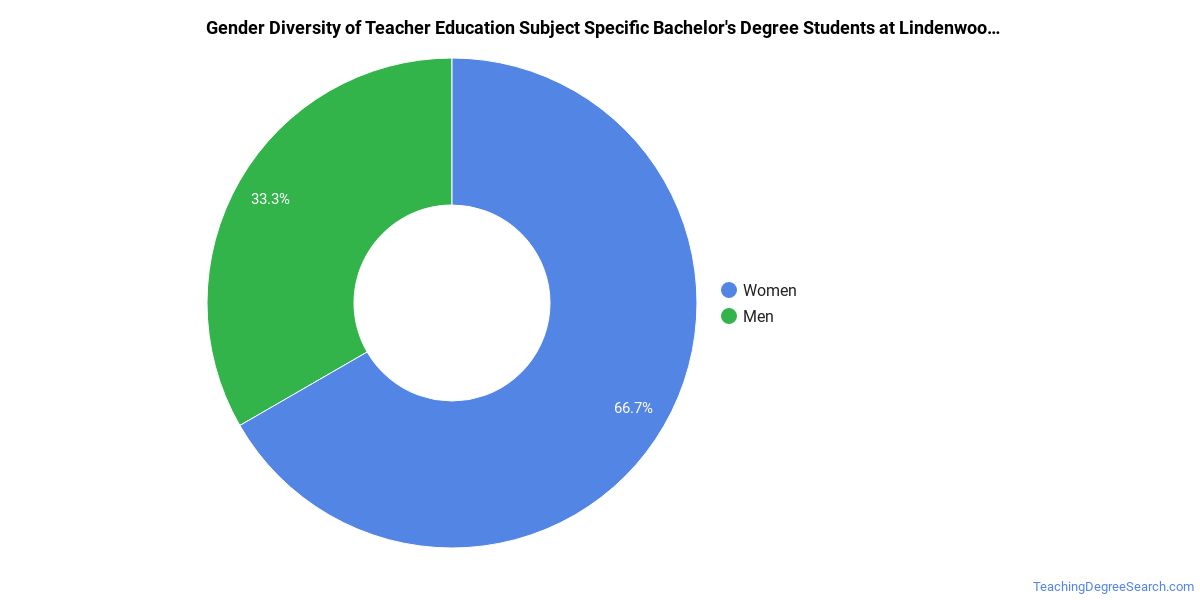
Teacher Education Subject Specific Bachelor’s Program at Lindenwood University
Of the 9 bachelor’s teacher education subject specific graduates at Lindenwood University, 44% were women (4) and 56% were men (5).
The following table and chart show the race/ethnicity of Teacher Education Subject Specific bachelor’s degree recipients at Lindenwood University.
| Race / Ethnicity | Number of Graduates |
|---|---|
| White | 7 |
| Asian | 2 |
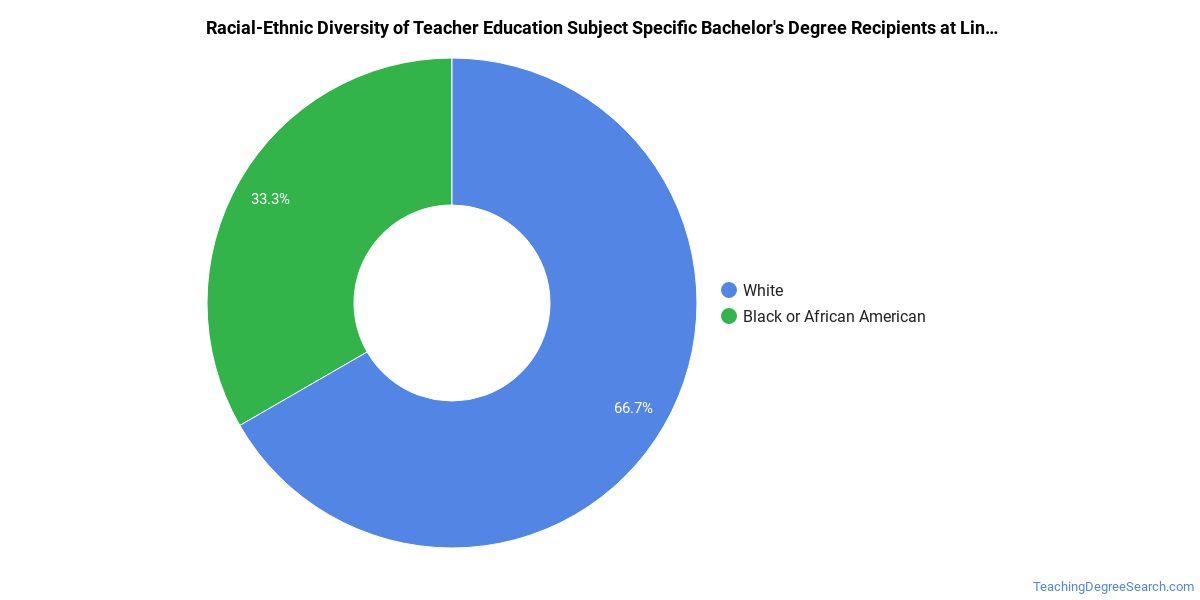
Racial-ethnic minorities make up 22% of Teacher Education Subject Specific bachelor’s degree recipients at Lindenwood University, below the national average of 25%.*
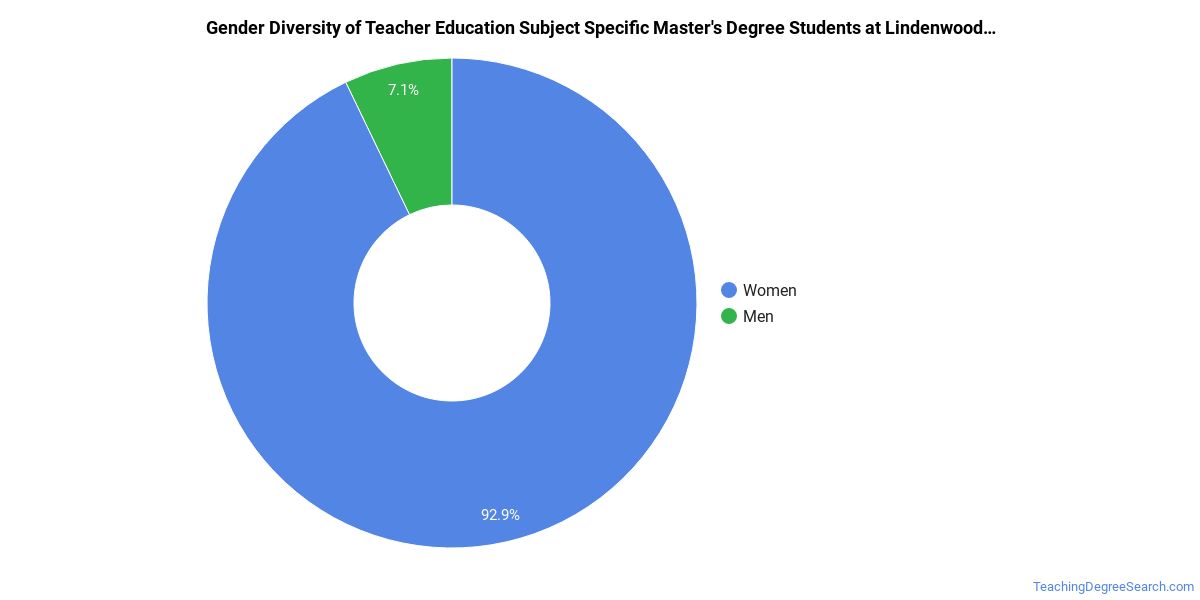
Teacher Education Subject Specific Master’s Program at Lindenwood University
Among the 12 master’s teacher education subject specific degrees awarded at Lindenwood University, 92% were women (11) and 8% were men (1).
The following table and chart show the race/ethnicity of Teacher Education Subject Specific master’s degree recipients at Lindenwood University.
| Race / Ethnicity | Number of Graduates |
|---|---|
| White | 10 |
| Black / African American | 1 |
| Unknown | 1 |
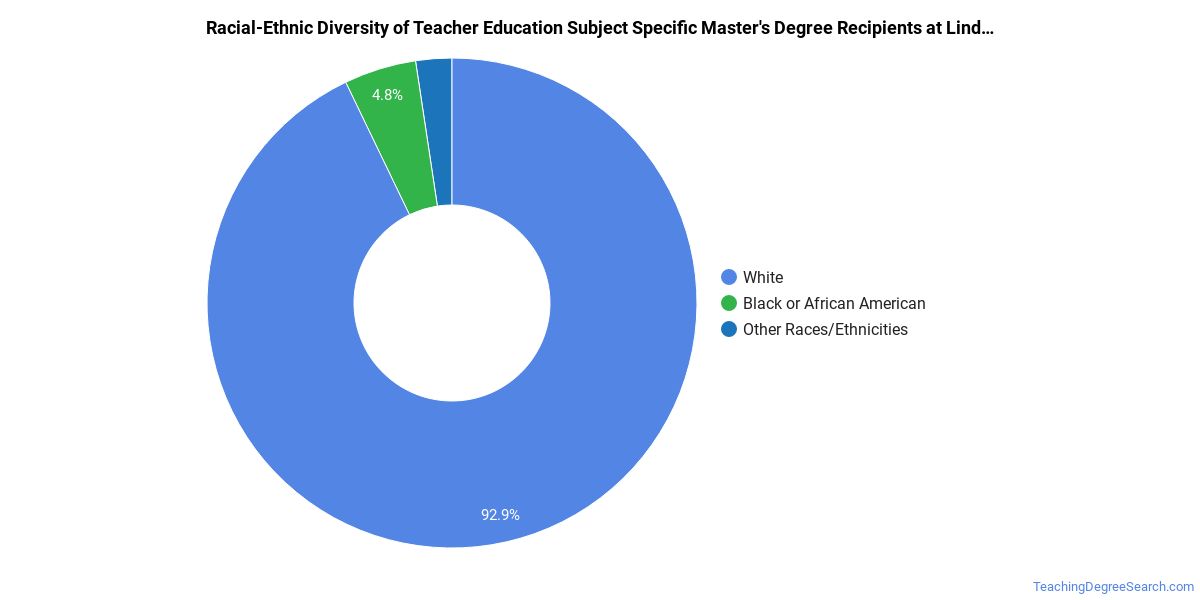
Minority students account for 8% of Teacher Education Subject Specific master’s degree recipients at Lindenwood University, lower than the national average of 23%.*
*The racial-ethnic minorities figure is the total number of graduates minus White, international (nonresident), and unknown-race graduates.
More Specific Teacher Education Subject Specific Concentrations at Lindenwood University
This Teacher Education Subject Specific program at Lindenwood University includes the following sub-specializations:
| Concentration | Graduates |
|---|---|
| Music Education | 1 |
| Physical Education & Coaching | 9 |
| Reading Education | 13 |
Top-Paying Careers for Teacher Education Subject Specific Graduates
Students who finish Teacher Education Subject Specific program at Lindenwood University work across a variety of fields. Here are the highest-paying careers for Teacher Education Subject Specific majors, ordered by median annual salary:
| Occupation | Nationwide Median Wage |
|---|---|
| Family and Consumer Sciences Teachers, Postsecondary | $99,604 |
| Psychology Teachers, Postsecondary | $98,479 |
| Education Teachers, Postsecondary | $98,329 |
| English Language and Literature Teachers, Postsecondary | $88,437 |
| Career/Technical Education Teachers, Postsecondary | $86,398 |
| Recreation and Fitness Studies Teachers, Postsecondary | $84,688 |
| Teachers and Instructors, All Other | $83,682 |
| Environmental Science Teachers, Postsecondary | $83,485 |
| Middle School Teachers, Except Special and Career/Technical Education | $83,105 |
| Physics Teachers, Postsecondary | $80,685 |
References
- IPEDS — Integrated Postsecondary Education Data System
- U.S. Department of Education — College Scorecard
- O*NET Online (Bureau of Labor Statistics)
- National Center for Education Statistics
More about our data sources and methodologies.
TeachingDegreeSearch.com provides higher-education, college and university, degree, program, career, salary, and other helpful information to students, faculty, institutions, and other internet audiences. Presented information and data are subject to change. Inclusion on this website does not imply or represent a direct relationship with the company, school, or brand. Information, though believed correct at time of publication, may not be correct, and no warranty is provided. Contact the schools to verify any information before relying on it. Financial aid may be available for those who qualify. The displayed options may include sponsored or recommended results, not necessarily based on your preferences.
© TeachingDegreeSearch.com – All Rights Reserved.