Teacher Education Subject Specific at University of Lynchburg
If you are interested in studying Teacher Education Subject Specific, consider the program at University of Lynchburg. The following information will help you decide if it is a good fit for you.
University of Lynchburg is in Lynchburg, VA.
For the most recent IPEDS reporting year, 11 teacher education subject specific degrees were granted at University of Lynchburg.
Featured schools near , edit
Online & Distance Learning at University of Lynchburg
Online coursework is an option at University of Lynchburg. Among 2,316 students, 441 (19%) were enrolled entirely in distance education and 498 (22%) took at least some classes online.
Teacher Education Subject Specific Rankings at University of Lynchburg
These rankings give you a sense of how University of Lynchburg’s Teacher Education Subject Specific program to other colleges that offer this major.
Bachelor’s-Level Rankings
| Ranking | Scope | Rank |
|---|---|---|
| Best Schools (Quality) | Southeast (Region) | #None of 120 |
| Best Schools (Quality) | Nationwide | #None of 571 |
| Best Schools (Quality) | Virginia | #None of 13 |
| Best Value | Southeast (Region) | #None of 119 |
| Best Value | Nationwide | #None of 566 |
| Best Value | Virginia | #None of 13 |
Master’s-Level Rankings
| Ranking | Scope | Rank |
|---|---|---|
| Best Schools (Quality) | Southeast (Region) | #None of 120 |
| Best Schools (Quality) | Nationwide | #None of 571 |
| Best Schools (Quality) | Virginia | #None of 13 |
| Best Value | Southeast (Region) | #None of 119 |
| Best Value | Nationwide | #None of 566 |
| Best Value | Virginia | #None of 13 |
Student Demographics & Diversity
The following sections describe the student demographics for Teacher Education Subject Specific graduates at University of Lynchburg, by degree type.
Program-wide, Teacher Education Subject Specific graduates at University of Lynchburg are 73% women (8) and 27% men (3).
Teacher Education Subject Specific Bachelor’s Program at University of Lynchburg
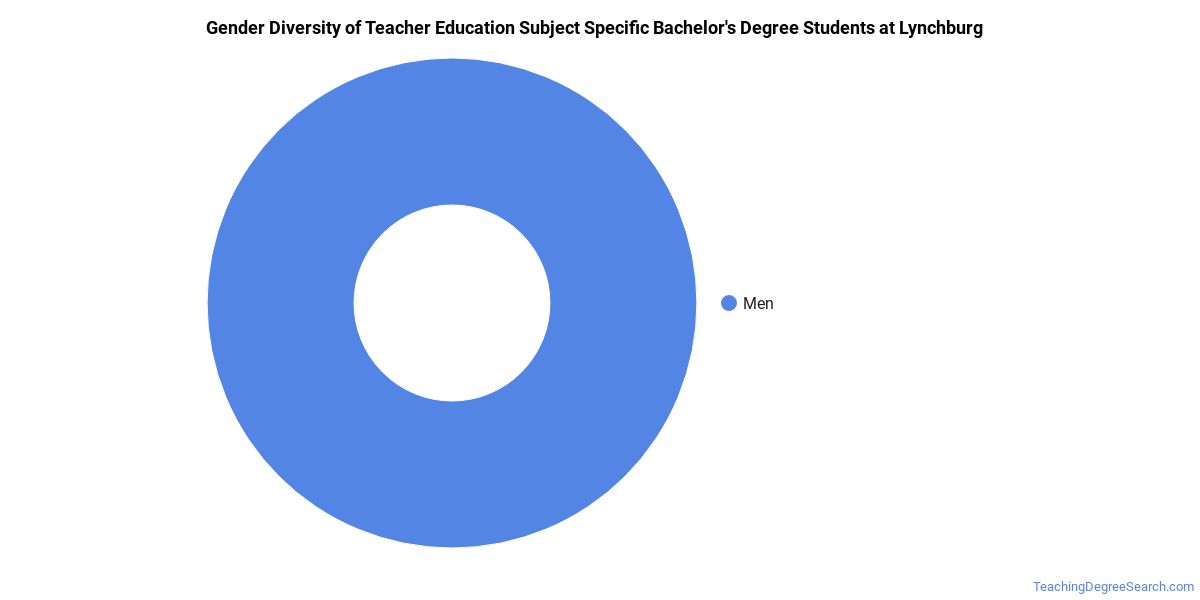
Of the 7 bachelor’s teacher education subject specific graduates at University of Lynchburg, 71% were women (5) and 29% were men (2).
The following table and chart show the race/ethnicity of Teacher Education Subject Specific bachelor’s degree recipients at University of Lynchburg.
| Race / Ethnicity | Number of Graduates |
|---|---|
| White | 4 |
| Hispanic / Latino | 1 |
| Black / African American | 2 |
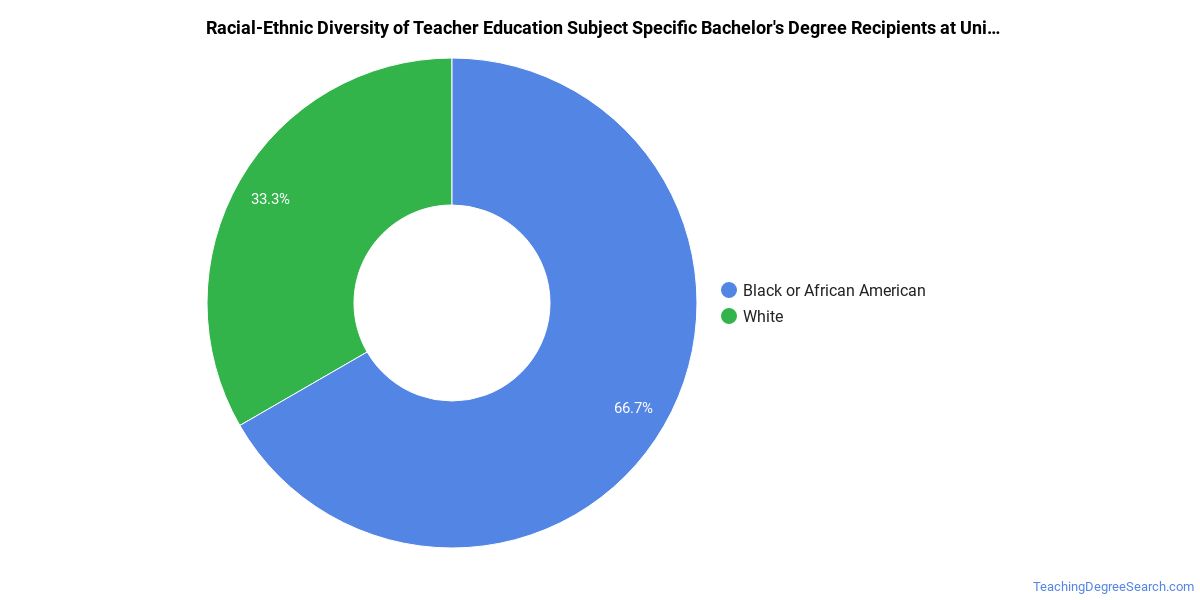
Minority students account for 43% of Teacher Education Subject Specific bachelor’s degree recipients at University of Lynchburg, higher than the national average of 25%.*
Teacher Education Subject Specific Master’s Program at University of Lynchburg
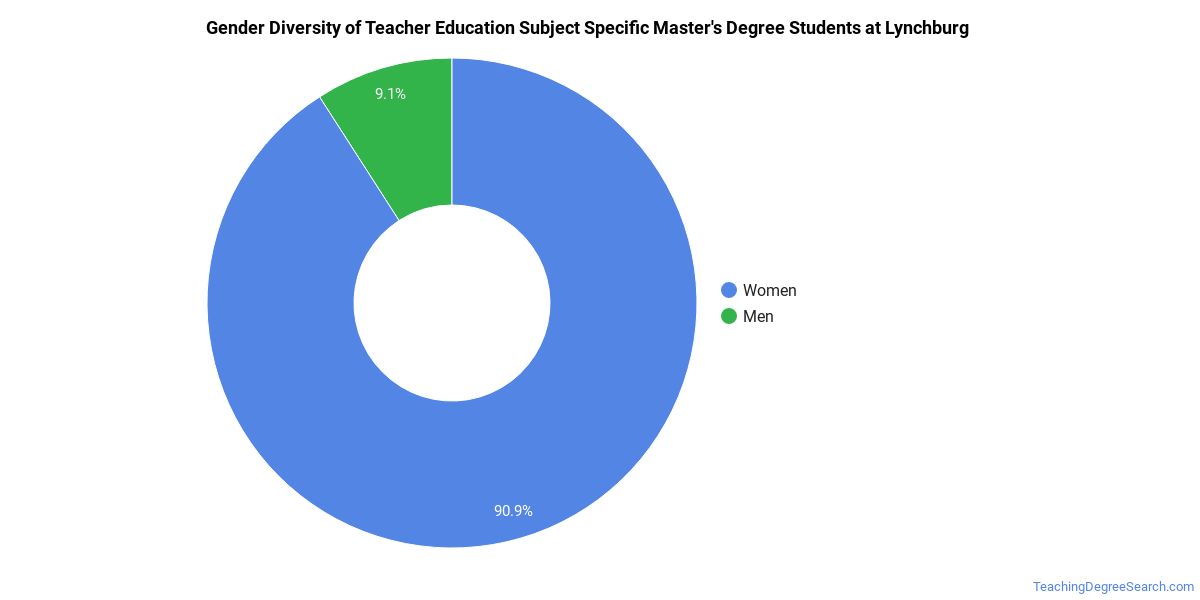
Among the 4 master’s teacher education subject specific graduates at University of Lynchburg, 75% were women (3) and 25% were men (1).
The following table and chart show the race/ethnicity of Teacher Education Subject Specific master’s degree recipients at University of Lynchburg.
| Race / Ethnicity | Number of Graduates |
|---|---|
| White | 3 |
| Two or More Races | 1 |
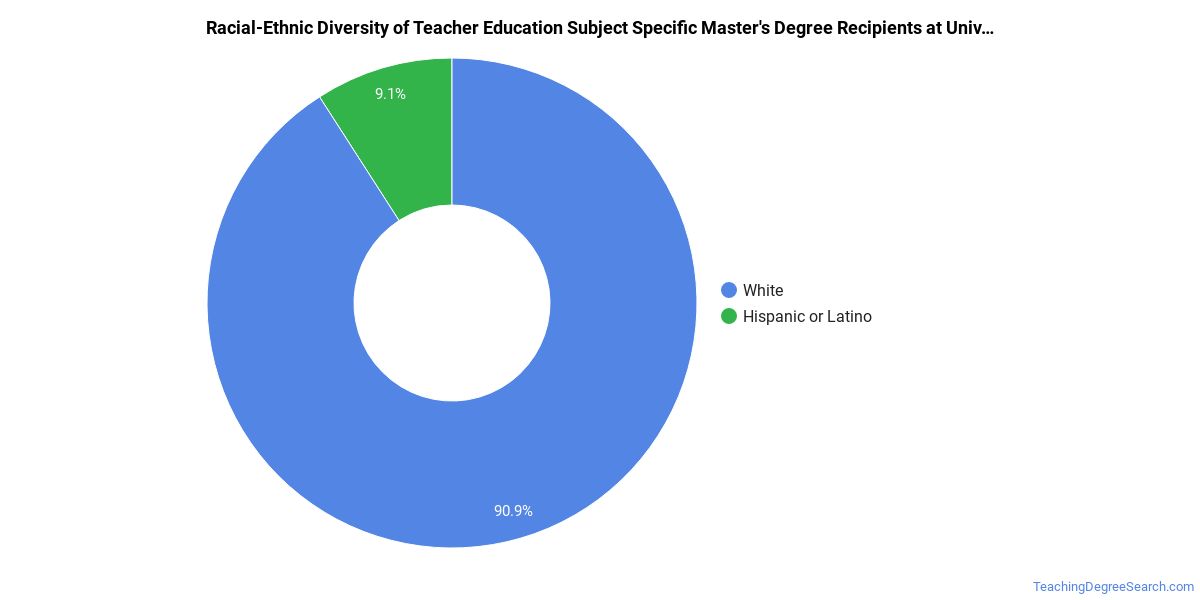
Racial-ethnic minorities make up 25% of Teacher Education Subject Specific master’s degree recipients at University of Lynchburg, above the national average of 23%.*
*The racial-ethnic minorities figure is the total number of graduates minus White, international (nonresident), and unknown-race graduates.
More Specific Teacher Education Subject Specific Concentrations at University of Lynchburg
This Teacher Education Subject Specific program at University of Lynchburg offers more specialized concentrations:
| Concentration | Graduates |
|---|---|
| Mathematics Education | 1 |
| Music Education | 4 |
| Science Education | 4 |
| Spanish Education | 1 |
| Earth Science Teacher Education | 1 |
Best-Paid Careers for Teacher Education Subject Specific Graduates
Graduates of the Teacher Education Subject Specific program at University of Lynchburg go on to a range of careers. Below are the best-paid careers for Teacher Education Subject Specific majors, ordered by median annual salary:
| Occupation | Nationwide Median Wage |
|---|---|
| Family and Consumer Sciences Teachers, Postsecondary | $99,604 |
| Psychology Teachers, Postsecondary | $98,479 |
| Education Teachers, Postsecondary | $98,329 |
| English Language and Literature Teachers, Postsecondary | $88,437 |
| Career/Technical Education Teachers, Postsecondary | $86,398 |
| Recreation and Fitness Studies Teachers, Postsecondary | $84,688 |
| Teachers and Instructors, All Other | $83,682 |
| Environmental Science Teachers, Postsecondary | $83,485 |
| Middle School Teachers, Except Special and Career/Technical Education | $83,105 |
| Physics Teachers, Postsecondary | $80,685 |
References
- IPEDS — Integrated Postsecondary Education Data System
- U.S. Department of Education — College Scorecard
- O*NET Online (Bureau of Labor Statistics)
- National Center for Education Statistics
More about our data sources and methodologies.
TeachingDegreeSearch.com provides higher-education, college and university, degree, program, career, salary, and other helpful information to students, faculty, institutions, and other internet audiences. Presented information and data are subject to change. Inclusion on this website does not imply or represent a direct relationship with the company, school, or brand. Information, though believed correct at time of publication, may not be correct, and no warranty is provided. Contact the schools to verify any information before relying on it. Financial aid may be available for those who qualify. The displayed options may include sponsored or recommended results, not necessarily based on your preferences.
© TeachingDegreeSearch.com – All Rights Reserved.