Teacher Education Grade Specific at Marymount University
What traits are you looking for in a school for Teacher Education Grade Specific, take a look at what Marymount University. We’ve gathered the following information to help you decide.
Marymount University is located in Arlington, VA.
For the most recent IPEDS reporting year, 9 teacher education grade specific graduations were recorded at Marymount University.
Featured schools near , edit
Online Class Availability at Marymount University
Distance learning is available at Marymount University. Among 4,060 students, 832 (20%) were enrolled entirely in distance education and 1,184 (29%) took at least some classes online.
Teacher Education Grade Specific Rankings at Marymount University
These rankings give you a sense of how Marymount University’s Teacher Education Grade Specific program to other colleges that offer this major.
Bachelor’s-Level Rankings
| Ranking | Scope | Rank |
|---|---|---|
| Best Schools (Quality) | Southeast (Region) | #None of 309 |
| Best Schools (Quality) | Nationwide | #None of 1,231 |
| Best Schools (Quality) | Virginia | #None of 20 |
| Best Value | Southeast (Region) | #None of 311 |
| Best Value | Nationwide | #None of 1,224 |
| Best Value | Virginia | #None of 20 |
Master’s-Level Rankings
| Ranking | Scope | Rank |
|---|---|---|
| Best Schools (Quality) | Southeast (Region) | #None of 309 |
| Best Schools (Quality) | Nationwide | #None of 1,231 |
| Best Schools (Quality) | Virginia | #None of 20 |
| Best Value | Southeast (Region) | #None of 311 |
| Best Value | Nationwide | #None of 1,224 |
| Best Value | Virginia | #None of 20 |
Earnings for Teacher Education Grade Specific Graduates from Marymount University
Graduates of Marymount University’s Teacher Education Grade Specific program earn at the following median levels (per the U.S. Department of Education’s College Scorecard):

| Years After Graduation | Median Earnings |
|---|---|
| 1 year | $54,631 |
| 2 years | $52,549 |
| 3 years | $54,497 |
| 4 years | $59,548 |
| 5 years | $66,326 |
How does this compare to the school overall? Four years out, Teacher Education Grade Specific graduates from Marymount University report median earnings of $59,548, compared with $74,353 for all Marymount University graduates — about 20% lower than the school-wide median.

Student Demographics & Diversity
Take a look at the composition of Teacher Education Grade Specific graduates at Marymount University, by degree type.
Program-wide, Teacher Education Grade Specific graduates at Marymount University are 89% women (8) and 11% men (1).
Teacher Education Grade Specific Bachelor’s Program at Marymount University
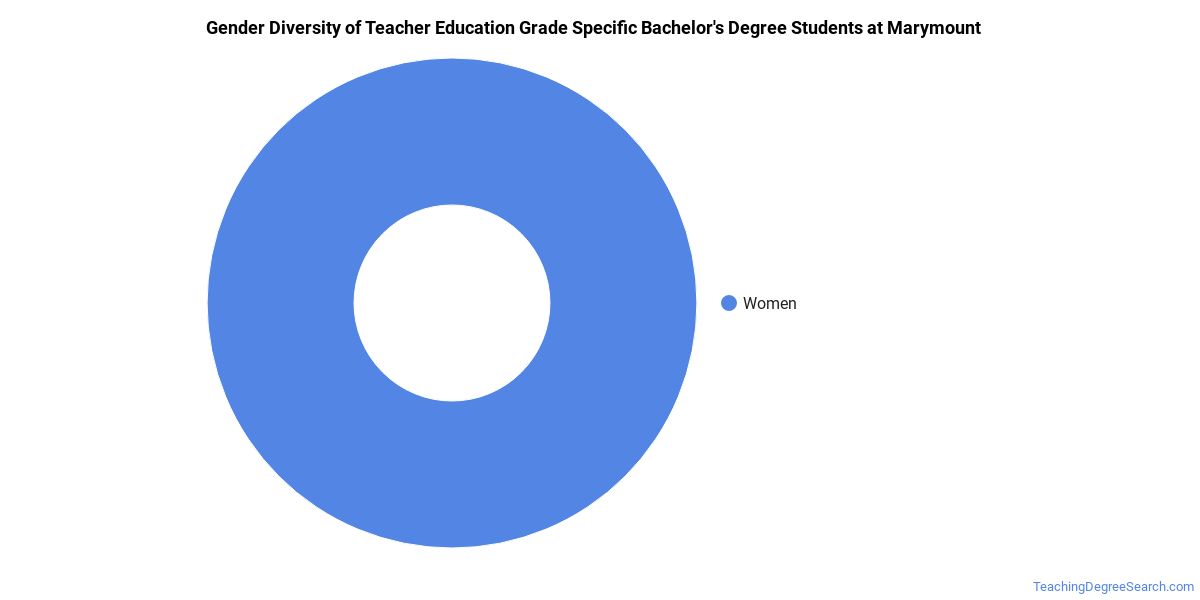
Among the 6 bachelor’s teacher education grade specific graduates at Marymount University, 83% were women (5) and 17% were men (1).
The following table and chart show the race/ethnicity of Teacher Education Grade Specific bachelor’s degree recipients at Marymount University.
| Race / Ethnicity | Number of Graduates |
|---|---|
| White | 3 |
| Hispanic / Latino | 1 |
| Two or More Races | 2 |
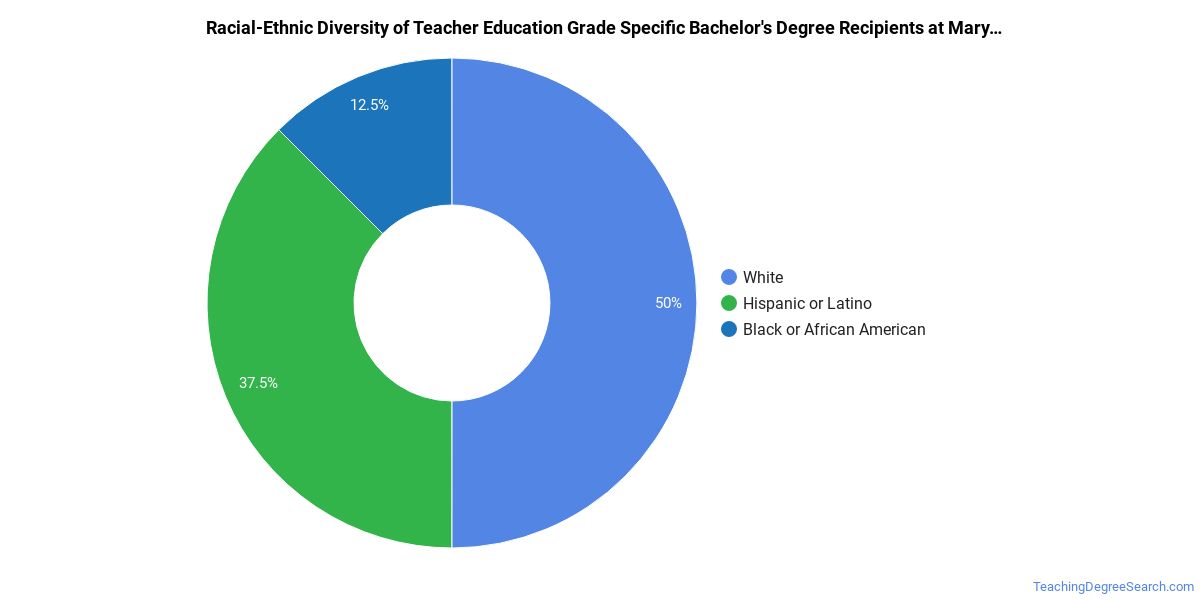
Minority students account for 50% of Teacher Education Grade Specific bachelor’s degree recipients at Marymount University, higher than the national average of 29%.*
Teacher Education Grade Specific Master’s Program at Marymount University
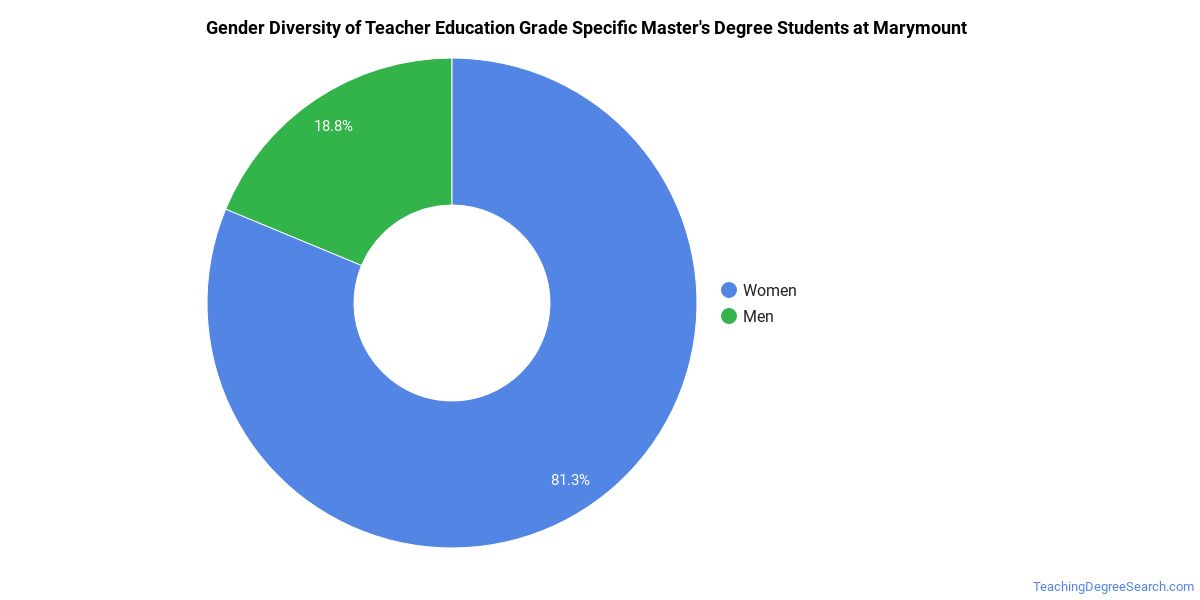
Among the 3 master’s teacher education grade specific degrees awarded at Marymount University, 100% were women (3) and 0% were men (0).
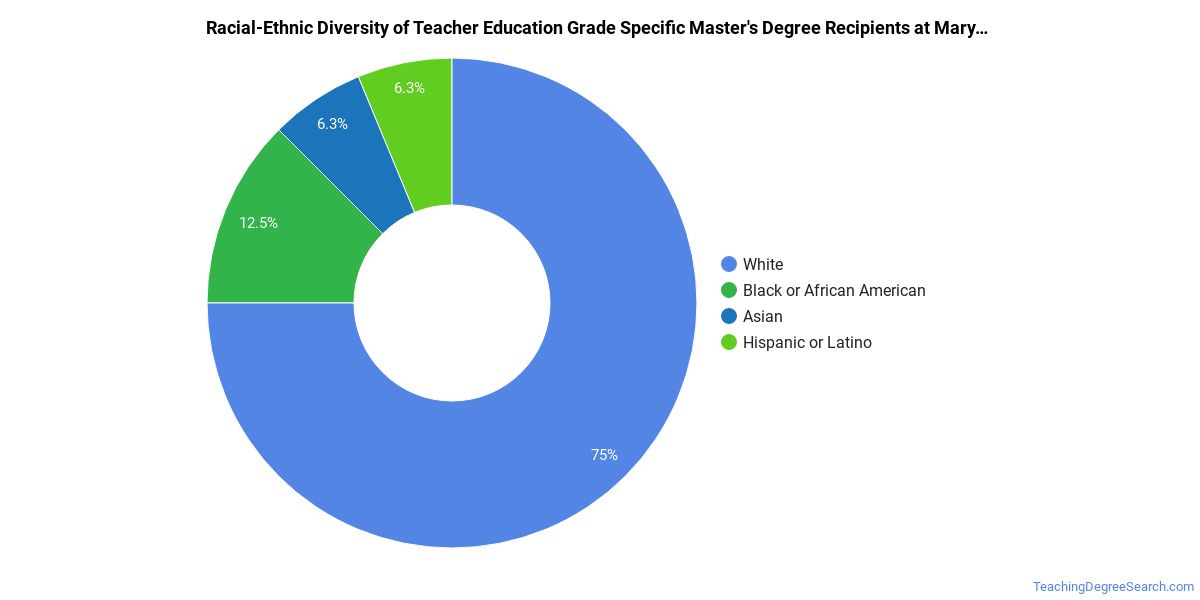
The following table and chart show the race/ethnicity of Teacher Education Grade Specific master’s degree recipients at Marymount University.
| Race / Ethnicity | Number of Graduates |
|---|---|
| White | 3 |
*The racial-ethnic minorities figure is the total number of graduates minus White, international (nonresident), and unknown-race graduates.
More Specific Teacher Education Grade Specific Concentrations at Marymount University
This Teacher Education Grade Specific program at Marymount University breaks down into more specific concentrations:
| Concentration | Graduates |
|---|---|
| Elementary Education | 8 |
| Secondary Education | 1 |
Best-Paid Careers for Teacher Education Grade Specific Graduates
Graduates of the Teacher Education Grade Specific program at Marymount University work across a variety of fields. Below are the top-paying careers for Teacher Education Grade Specific majors, ordered by median annual salary:
References
- IPEDS — Integrated Postsecondary Education Data System
- U.S. Department of Education — College Scorecard
- O*NET Online (Bureau of Labor Statistics)
- National Center for Education Statistics
More about our data sources and methodologies.
TeachingDegreeSearch.com provides higher-education, college and university, degree, program, career, salary, and other helpful information to students, faculty, institutions, and other internet audiences. Presented information and data are subject to change. Inclusion on this website does not imply or represent a direct relationship with the company, school, or brand. Information, though believed correct at time of publication, may not be correct, and no warranty is provided. Contact the schools to verify any information before relying on it. Financial aid may be available for those who qualify. The displayed options may include sponsored or recommended results, not necessarily based on your preferences.
© TeachingDegreeSearch.com – All Rights Reserved.