General Special Education at Slippery Rock University of Pennsylvania
What traits are you looking for in a school for General Special Education, you may want to check out the program at Slippery Rock University of Pennsylvania. Get started with the following essential facts.
Slippery Rock University of Pennsylvania sits in Slippery Rock, PA.
During the most recent reporting year, 213 general special education graduations were recorded at Slippery Rock University of Pennsylvania.
Featured schools near , edit
Online & Distance Learning at Slippery Rock University of Pennsylvania
Distance learning is available at Slippery Rock University of Pennsylvania. Among 8,376 students, 1,273 (15%) studied exclusively online and 2,697 (32%) took at least some classes online.
General Special Education Rankings at Slippery Rock University of Pennsylvania
Use these rankings to compare Slippery Rock University of Pennsylvania’s General Special Education program against peer institutions.
Bachelor’s-Level Rankings
| Ranking | Scope | Rank |
|---|---|---|
| Best Value | Pennsylvania | #9 of 29 |
| Best Schools (Quality) | Pennsylvania | #16 of 24 |
| Best Value | Middle Atlantic (Region) | #40 of 85 |
| Best Schools (Quality) | Middle Atlantic (Region) | #44 of 57 |
| Best Schools (Quality) | Nationwide | #199 of 351 |
| Best Value | Nationwide | #269 of 404 |
Master’s-Level Rankings
| Ranking | Scope | Rank |
|---|---|---|
| Best Value | Pennsylvania | #9 of 29 |
| Best Schools (Quality) | Pennsylvania | #16 of 24 |
| Best Value | Middle Atlantic (Region) | #40 of 85 |
| Best Schools (Quality) | Middle Atlantic (Region) | #44 of 57 |
| Best Schools (Quality) | Nationwide | #199 of 351 |
| Best Value | Nationwide | #269 of 404 |
Doctoral-Level Rankings
| Ranking | Scope | Rank |
|---|---|---|
| Best Value | Pennsylvania | #9 of 29 |
| Best Schools (Quality) | Pennsylvania | #16 of 24 |
| Best Value | Middle Atlantic (Region) | #40 of 85 |
| Best Schools (Quality) | Middle Atlantic (Region) | #44 of 57 |
| Best Schools (Quality) | Nationwide | #199 of 351 |
| Best Value | Nationwide | #269 of 404 |
Student Demographics & Diversity
The following sections describe the student demographics for General Special Education graduates at Slippery Rock University of Pennsylvania, by degree type.
Program-wide, General Special Education graduates at Slippery Rock University of Pennsylvania are 87% women (185) and 13% men (28).
General Special Education Bachelor’s Program at Slippery Rock University of Pennsylvania
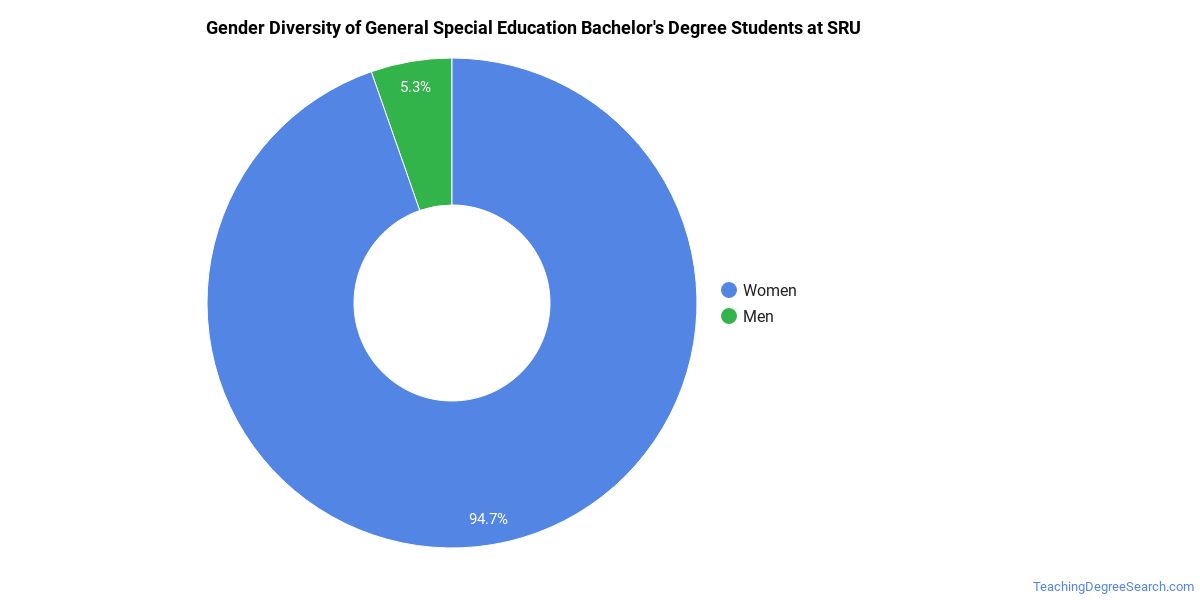
Among the 102 bachelor’s general special education degrees awarded at Slippery Rock University of Pennsylvania, 83% were women (85) and 17% were men (17).
The following table and chart show the race/ethnicity of General Special Education bachelor’s degree recipients at Slippery Rock University of Pennsylvania.
| Race / Ethnicity | Number of Graduates |
|---|---|
| White | 97 |
| Hispanic / Latino | 1 |
| Two or More Races | 3 |
| Unknown | 1 |
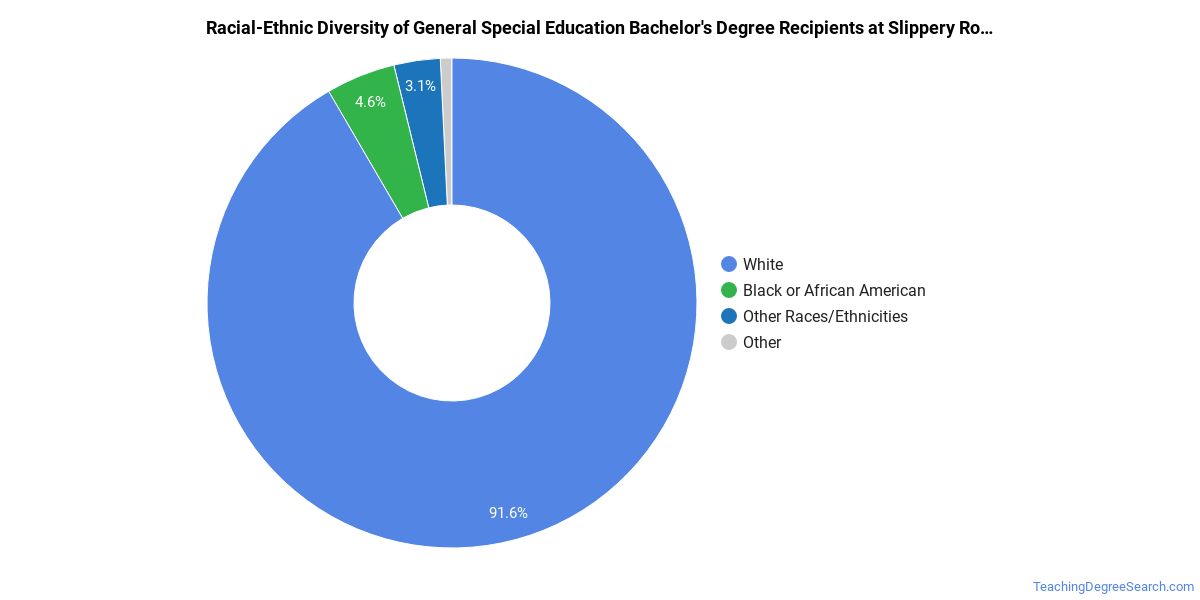
Minority students account for 4% of General Special Education bachelor’s degree recipients at Slippery Rock University of Pennsylvania, below the national average of 21%.*
General Special Education Master’s Program at Slippery Rock University of Pennsylvania
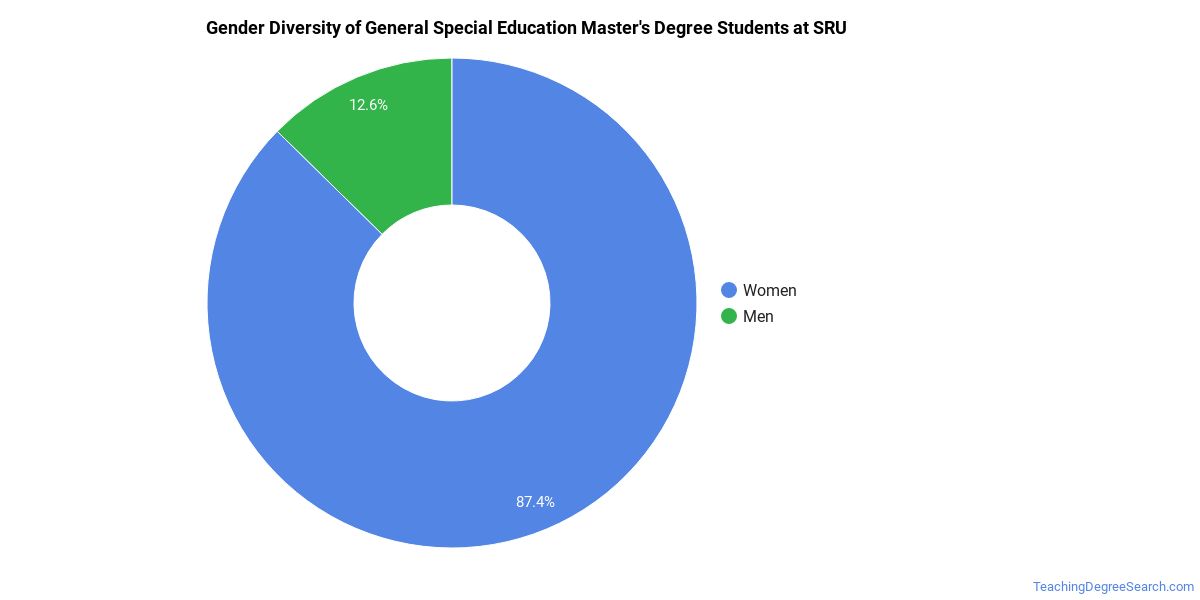
Of the 88 master’s general special education degrees awarded at Slippery Rock University of Pennsylvania, 90% were women (79) and 10% were men (9).
The following table and chart show the race/ethnicity of General Special Education master’s degree recipients at Slippery Rock University of Pennsylvania.
| Race / Ethnicity | Number of Graduates |
|---|---|
| White | 83 |
| Hispanic / Latino | 1 |
| Two or More Races | 2 |
| Unknown | 2 |
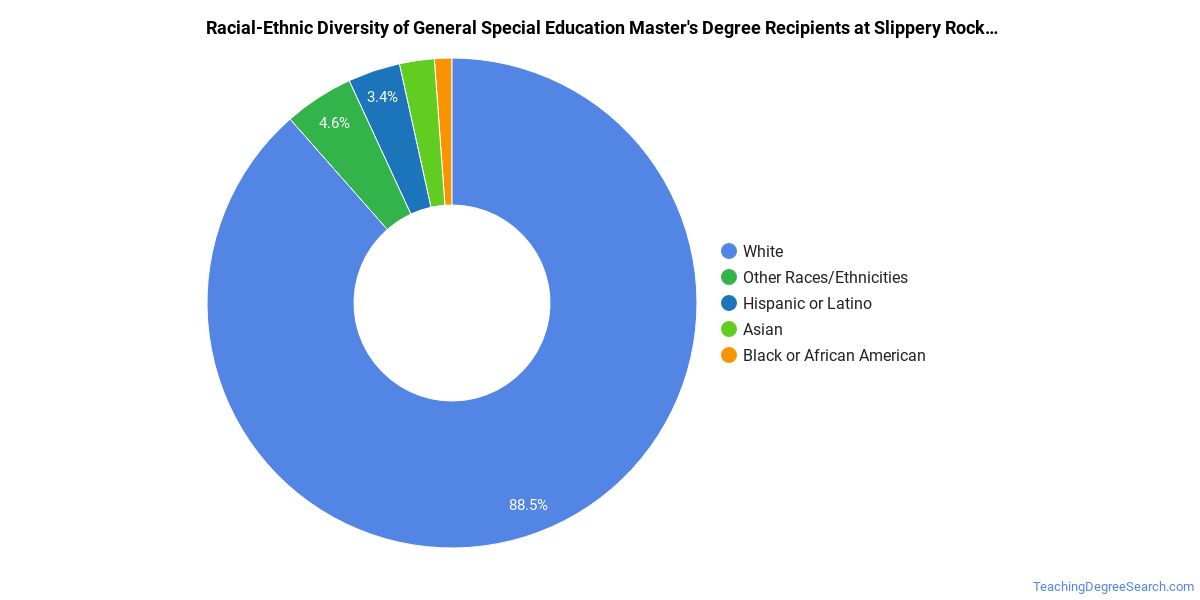
Racial-ethnic minorities make up 3% of General Special Education master’s degree recipients at Slippery Rock University of Pennsylvania, lower than the national average of 32%.*
General Special Education Doctoral Program at Slippery Rock University of Pennsylvania
Of the 23 doctoral general special education graduates at Slippery Rock University of Pennsylvania, 91% were women (21) and 9% were men (2).

The following table and chart show the race/ethnicity of General Special Education doctoral degree recipients at Slippery Rock University of Pennsylvania.
| Race / Ethnicity | Number of Graduates |
|---|---|
| White | 22 |
| Two or More Races | 1 |

Minority students account for 4% of General Special Education doctoral degree recipients at Slippery Rock University of Pennsylvania, below the national average of 19%.*
*The racial-ethnic minorities figure is the total number of graduates minus White, international (nonresident), and unknown-race graduates.
Highest-Paying Careers for General Special Education Graduates
Those who complete General Special Education program at Slippery Rock University of Pennsylvania pursue many career paths. Here are the best-paid careers for General Special Education majors, ordered by median annual salary:
| Occupation | Nationwide Median Wage |
|---|---|
| Teaching Assistants, Special Education | $96,801 |
| Special Education Teachers, All Other | $86,208 |
| Special Education Teachers, Middle School | $80,694 |
| Special Education Teachers, Secondary School | $79,680 |
| Adapted Physical Education Specialists | $77,976 |
| Special Education Teachers, Kindergarten | $73,597 |
| Special Education Teachers, Elementary School | $50,045 |
| Special Education Teachers, Preschool | $35,173 |
References
- IPEDS — Integrated Postsecondary Education Data System
- U.S. Department of Education — College Scorecard
- O*NET Online (Bureau of Labor Statistics)
- National Center for Education Statistics
More about our data sources and methodologies.
TeachingDegreeSearch.com provides higher-education, college and university, degree, program, career, salary, and other helpful information to students, faculty, institutions, and other internet audiences. Presented information and data are subject to change. Inclusion on this website does not imply or represent a direct relationship with the company, school, or brand. Information, though believed correct at time of publication, may not be correct, and no warranty is provided. Contact the schools to verify any information before relying on it. Financial aid may be available for those who qualify. The displayed options may include sponsored or recommended results, not necessarily based on your preferences.
© TeachingDegreeSearch.com – All Rights Reserved.