Teacher Education Grade Specific at St. Francis College
If you are interested in studying Teacher Education Grade Specific, consider the program at St. Francis College. The following information will help you decide if it is a good fit for you.
St. Francis College is in Brooklyn, NY.
For the most recent IPEDS reporting year, 18 teacher education grade specific degrees were granted at St. Francis College.
Featured schools near , edit
Online & Distance Learning at St. Francis College
Online coursework is an option at St. Francis College. Of 4,567 students, 53 (1%) were enrolled entirely in distance education and 4,507 (99%) took at least some classes online.
Earnings for Teacher Education Grade Specific Graduates from St. Francis College
Those who finish St. Francis College’s Teacher Education Grade Specific program report the following median earnings (per the U.S. Department of Education’s College Scorecard):
| Years After Graduation | Median Earnings |
|---|---|
| 2 years | $36,668 |
| 3 years | $42,820 |
| 4 years | $63,372 |
| 5 years | $70,522 |
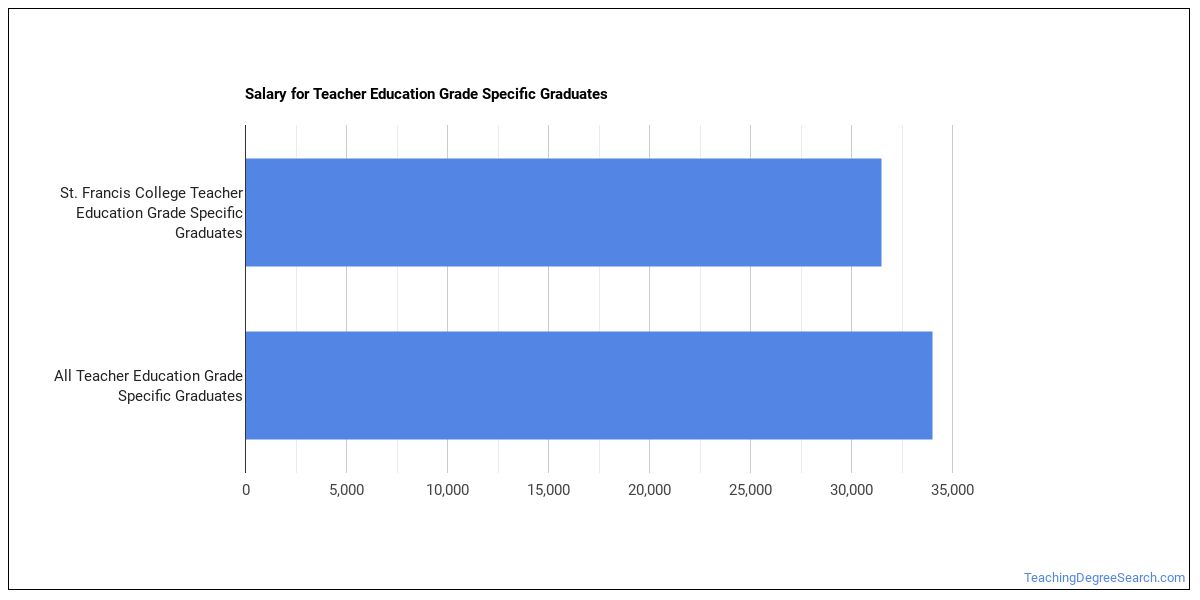
Is this above or below average for the school? Four years after graduating, Teacher Education Grade Specific graduates from St. Francis College report median earnings of $63,372, compared with $68,132 for all St. Francis College graduates — about 7% lower than the school-wide median.

Student Demographics & Diversity
Below you’ll find the composition of Teacher Education Grade Specific graduates at St. Francis College, by degree type.
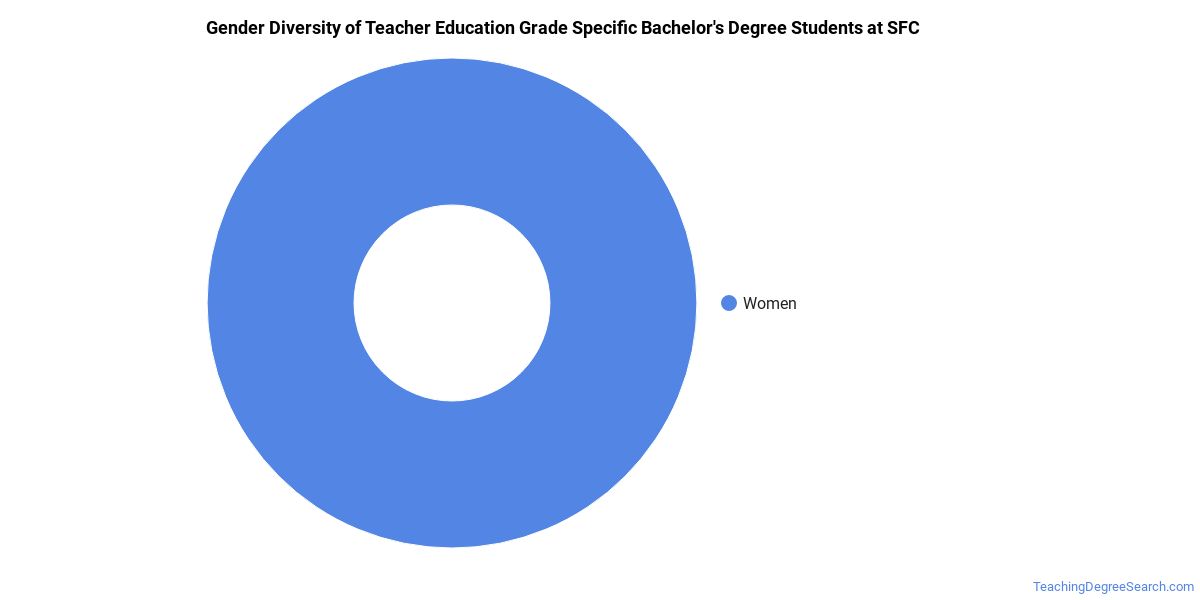
Looking at the program as a whole, Teacher Education Grade Specific graduates at St. Francis College are 100% women (18) and 0% men (0).
Teacher Education Grade Specific Bachelor’s Program at St. Francis College
Among the 17 bachelor’s teacher education grade specific graduates at St. Francis College, 100% were women (17) and 0% were men (0).
The following table and chart show the race/ethnicity of Teacher Education Grade Specific bachelor’s degree recipients at St. Francis College.
| Race / Ethnicity | Number of Graduates |
|---|---|
| White | 9 |
| Hispanic / Latino | 5 |
| Black / African American | 1 |
| International (Nonresident) | 1 |
| Unknown | 1 |
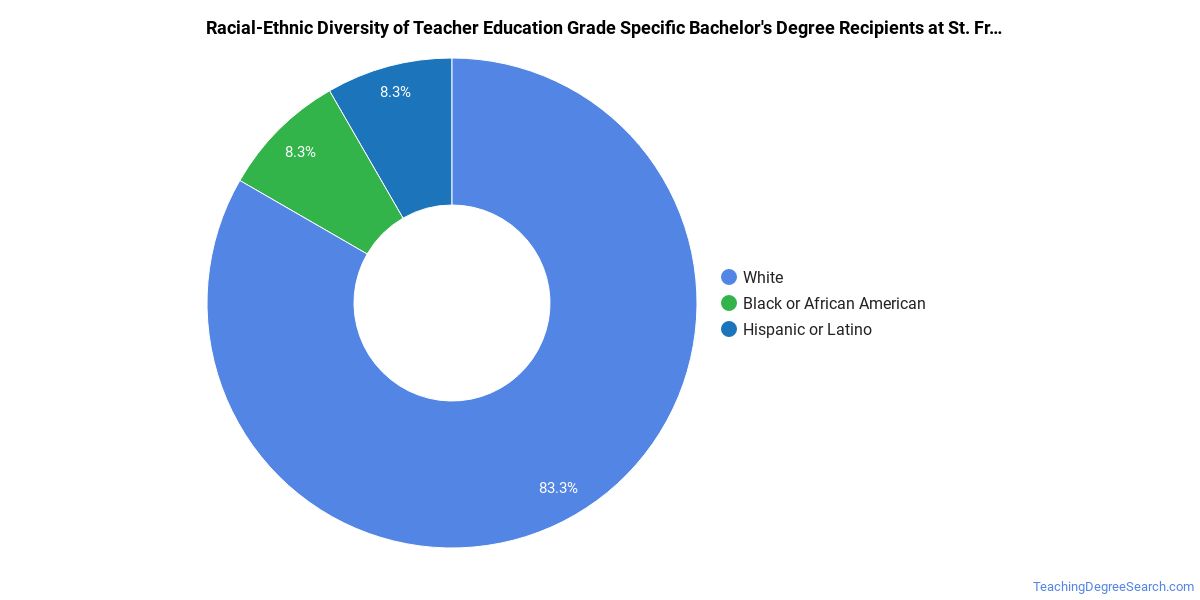
Racial-ethnic minorities make up 35% of Teacher Education Grade Specific bachelor’s degree recipients at St. Francis College, higher than the national average of 29%.*
*The racial-ethnic minorities figure is the total number of graduates minus White, international (nonresident), and unknown-race graduates.
More Specific Teacher Education Grade Specific Concentrations at St. Francis College
This Teacher Education Grade Specific program at St. Francis College breaks down into more specific concentrations:
| Concentration | Graduates |
|---|---|
| Elementary Education | 18 |
Top-Paying Careers for Teacher Education Grade Specific Graduates
Students who finish Teacher Education Grade Specific program at St. Francis College pursue many career paths. Here are the top-paying careers for Teacher Education Grade Specific graduates, ordered by median annual salary:
References
- IPEDS — Integrated Postsecondary Education Data System
- U.S. Department of Education — College Scorecard
- O*NET Online (Bureau of Labor Statistics)
- National Center for Education Statistics
More about our data sources and methodologies.
TeachingDegreeSearch.com provides higher-education, college and university, degree, program, career, salary, and other helpful information to students, faculty, institutions, and other internet audiences. Presented information and data are subject to change. Inclusion on this website does not imply or represent a direct relationship with the company, school, or brand. Information, though believed correct at time of publication, may not be correct, and no warranty is provided. Contact the schools to verify any information before relying on it. Financial aid may be available for those who qualify. The displayed options may include sponsored or recommended results, not necessarily based on your preferences.
© TeachingDegreeSearch.com – All Rights Reserved.