University of St Francis Teaching Programs
University of St Francis is a private not-for-profit institution located in Joliet, IL. The Suburbs Of A Large City provides an ideal setting near the excitement of urban amenities.
Featured schools near , edit
University of St Francis Rankings
University of St Francis is featured in these rankings for teaching programs at the bachelors level:
| Ranking | Rank | Among |
|---|---|---|
| Overall Quality | #11 of 188 | State — Illinois |
| Overall Quality | #32 of 719 | Region — Great Lakes |
| Overall Quality | #246 of 4,630 | Nationwide |
Where Is University of St Francis?
Get in touch with University of St Francis are given below.
| Contact Details | |
|---|---|
| Address: | 500 N Wilcox St, Joliet, IL 60435-6188 |
| Phone: | 8157403400 |
| Website: | www.stfrancis.edu/ |
| Admissions: | www.stfrancis.edu/admissions-aid/ |
| Financial Aid: | www.stfrancis.edu/admissions-aid/financial-aid-services/ |
How Do I Get Into University of St Francis?
You can apply to University of St Francis online at: https://myusf.stfrancis.edu/portal/apply
University of St Francis is classified as Moderately Selective (50-70%) for admissions.
Admission Requirements for University of St Francis
These are the things University of St Francis requires for admission:
| Requirement | Status |
|---|---|
| Secondary School Record | Required |
| Secondary School GPA | Required |
| Recommendations | Considered but not required |
| Admission Test Scores (SAT/ACT) | Considered but not required |
How Hard Is It To Get Into University of St Francis?
University of St Francis has an acceptance rate of 65%, making it fairly accessible. Be sure to prepare a complete application and prepare the application in full.
Of those admitted, 14% choose to enroll — a modest enrollment yield, suggesting many admitted students choose other institutions.
Average Test Scores
17% of admitted students submitted SAT scores and 2% submitted ACT scores.
When looking at the 25th through the 75th percentile of admitted students at University of St Francis, SAT Evidence-Based Reading and Writing scores ranged between 520 and 610. Math scores were between 510 and 610.
Selectivity by Gender
Admit rates at University of St Francis can differ by gender.
| Gender | Applicants | Admitted | Acceptance Rate |
|---|---|---|---|
| Men | 878 | 538 | 61% |
| Women | 1,372 | 931 | 68% |
Can I Afford University of St Francis?
The average net price after aid at University of St Francis is $16,284. Your actual cost will depend on your family’s circumstances since net price varies by income group.
Tuition & Fees
| Category | Cost |
|---|---|
| In-State Tuition | $38,110 |
| In-State Fees | $N/A |
| Out-of-State Tuition | $38,110 |
| Out-of-State Fees | $N/A |
| Total In-State Tuition & Fees | $38,110 |
| Total Out-of-State Tuition & Fees | $38,110 |
Financial Aid
Across all aid types, 17% of students at University of St Francis receive some form of financial aid (238 students).
Nearly 83% of students at University of St Francis receive grant or scholarship aid, averaging $28,878 per student.
39% of students receive federal Pell Grants, averaging $6,321.
Student Loan Debt
76% of University of St Francis undergraduates take out federal student loans, averaging $4,637 per year.
University of St Francis Undergraduate Student Diversity
There are 3,660 students enrolled at University of St Francis, including 1,292 undergraduate and 1,879 graduate students. University of St Francis is classified as a 1,000 - 4,999 institution by enrollment size. Its Carnegie Classification is Doctoral/Professional Universities.
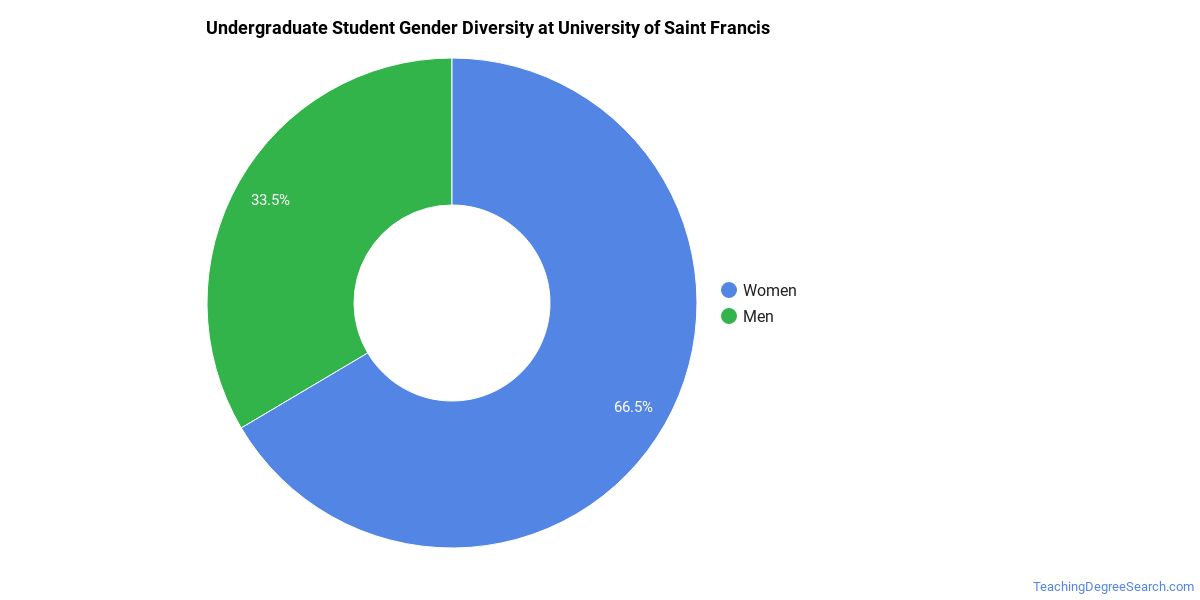
Gender Diversity
Of the 1,292 undergraduate students at University of St Francis, approximately 33% are male and 67% are female.
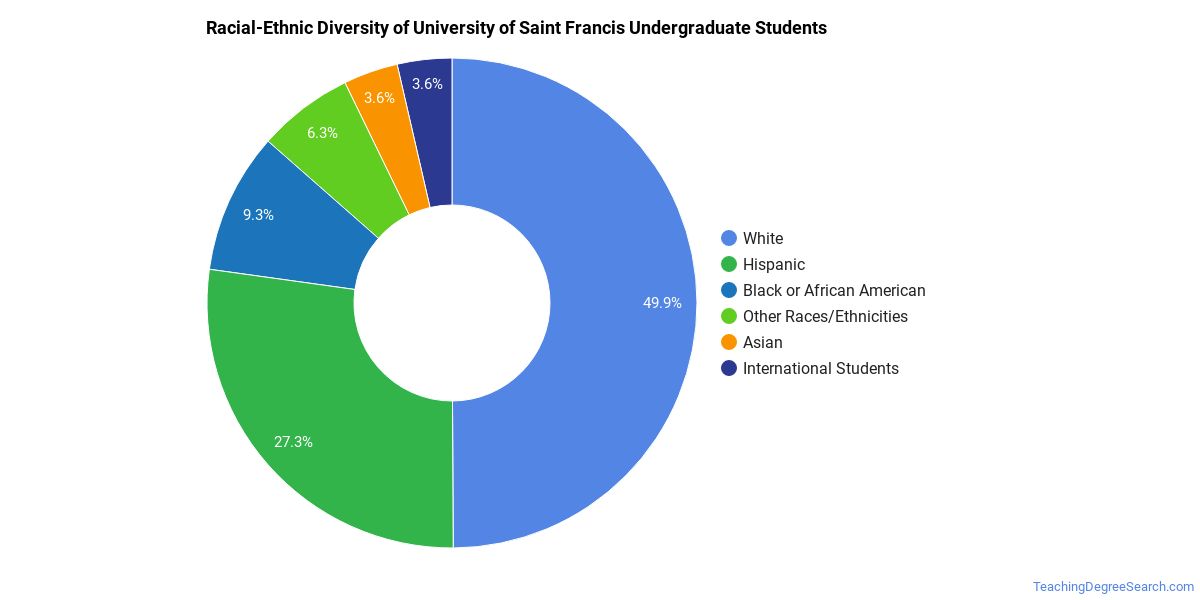
Racial-Ethnic Diversity
The racial-ethnic breakdown of University of St Francis undergraduate students is as follows.
| Race/Ethnicity | Number of Students |
|---|---|
| Asian | 36 |
| Black or African American | 126 |
| Hispanic | 425 |
| White | 605 |
| American Indian/Alaska Native | 1 |
| Native Hawaiian/Pacific Islander | 1 |
| Two or More Races | 41 |
| Non-Resident | 38 |
Geographic Diversity
The top 5 home states of first-time undergraduate students at University of St Francis are shown below.

| State | First-Time UG Students |
|---|---|
| Illinois | 190 |
| Indiana | 7 |
| Florida | 4 |
| Wisconsin | 3 |
| Arizona | 1 |
Additionally, approximately 3.0% of undergraduate students are non-resident from outside the United States.
University of St Francis Graduate Student Diversity
1,879 of University of St Francis’s students are in graduate programs. The highest graduate-level award offered is Doctor’s degree.
Gender Diversity (Graduate)
Among graduate students at University of St Francis, approximately 22% are male and 78% are female.

Racial-Ethnic Diversity (Graduate)
The racial-ethnic breakdown of University of St Francis graduate students is as follows.

| Race/Ethnicity | Number of Students |
|---|---|
| Asian | 82 |
| Black or African American | 170 |
| Hispanic | 304 |
| White | 1,270 |
| American Indian/Alaska Native | 1 |
| Native Hawaiian/Pacific Islander | 1 |
| Two or More Races | 26 |
| Non-Resident | 3 |
Online Learning at University of St Francis
University of St Francis provides online programs for students who need flexibility.
723 undergraduate students at University of St Francis took at least one online class — of those, 140 took all of their classes online.
At the graduate level, 167 students took at least one online class and 1,360 took all classes online. Distance education is available at the undergraduate and graduate levels.
Teaching Programs at University of St Francis
The following teaching majors are available at University of St Francis, with the number of degrees awarded at each level in the most recent reporting year.
| Program | Bachelor’s | Master’s | Doctorate | Total |
|---|---|---|---|---|
| Curriculum and Instruction | — | 160 | — | 160 |
| Educational Administration and Supervision | — | 32 | 34 | 66 |
| Teacher Education and Professional Development, Specific Levels and Methods | 15 | 11 | — | 27 |
| Teacher Education and Professional Development, Specific Subject Areas | — | 21 | — | 25 |
| Special Education and Teaching | 5 | 5 | — | 10 |
Academic Programs at University of St Francis
University of St Francis offers 19 distinct academic programs.
The highest level of award offered is Doctor’s degree.
Institutional Profile
University of St Francis has an open admission policy: No. Credit transfer:
- AP credits: Yes
- Dual enrollment credits: Yes
- Life experience credits: Implied no
References
More about our data sources and methodologies.
TeachingDegreeSearch.com provides higher-education, college and university, degree, program, career, salary, and other helpful information to students, faculty, institutions, and other internet audiences. Presented information and data are subject to change. Inclusion on this website does not imply or represent a direct relationship with the company, school, or brand. Information, though believed correct at time of publication, may not be correct, and no warranty is provided. Contact the schools to verify any information before relying on it. Financial aid may be available for those who qualify. The displayed options may include sponsored or recommended results, not necessarily based on your preferences.
© TeachingDegreeSearch.com – All Rights Reserved.