Science Education at Boston University
If you are interested in studying Science Education, consider the program at Boston University. We’ve gathered the following information to help you decide.
Boston University sits in Boston, MA.
In the most recent year for which we have data, 12 science education graduations were recorded at Boston University.
Featured schools near , edit
Online & Distance Learning at Boston University
Many students take online classes at Boston University. Among 37,737 students, 5,423 (14%) studied exclusively online and 1,354 (4%) took at least some classes online.
Science Education Rankings at Boston University
Rankings can help you compare Boston University’s Science Education program to other colleges that offer this major.
Bachelor’s-Level Rankings
| Ranking | Scope | Rank |
|---|---|---|
| Best Schools (Quality) | Massachusetts | #1 of 1 |
| Best Schools (Quality) | New England (Region) | #1 of 1 |
| Best Value | Massachusetts | #3 of 5 |
| Best Schools (Quality) | Nationwide | #7 of 19 |
| Best Value | New England (Region) | #13 of 16 |
| Best Value | Nationwide | #180 of 203 |
Master’s-Level Rankings
| Ranking | Scope | Rank |
|---|---|---|
| Best Schools (Quality) | Massachusetts | #1 of 1 |
| Best Schools (Quality) | New England (Region) | #1 of 1 |
| Best Value | Massachusetts | #3 of 5 |
| Best Schools (Quality) | Nationwide | #7 of 19 |
| Best Value | New England (Region) | #13 of 16 |
| Best Value | Nationwide | #180 of 203 |
Student Demographics & Diversity
Take a look at the composition of Science Education graduates at Boston University, broken down by degree level.
Program-wide, Science Education graduates at Boston University are 75% women (9) and 25% men (3).
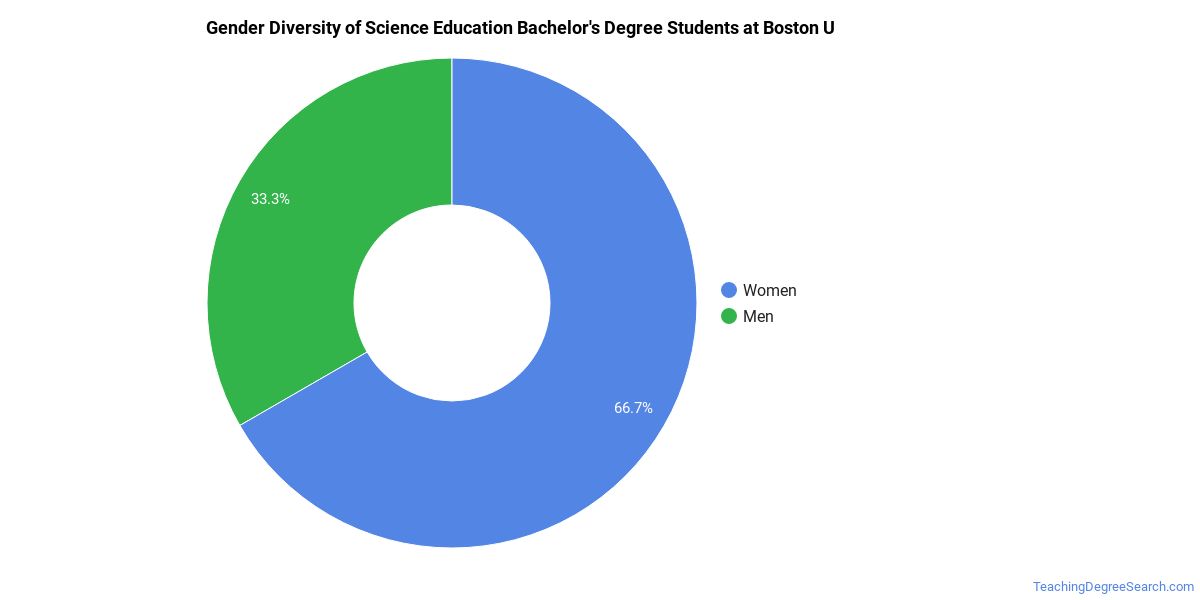
Science Education Bachelor’s Program at Boston University
Of the 2 bachelor’s science education graduates at Boston University, 100% were women (2) and 0% were men (0).
The following table and chart show the race/ethnicity of Science Education bachelor’s degree recipients at Boston University.
| Race / Ethnicity | Number of Graduates |
|---|---|
| White | 1 |
| Hispanic / Latino | 1 |
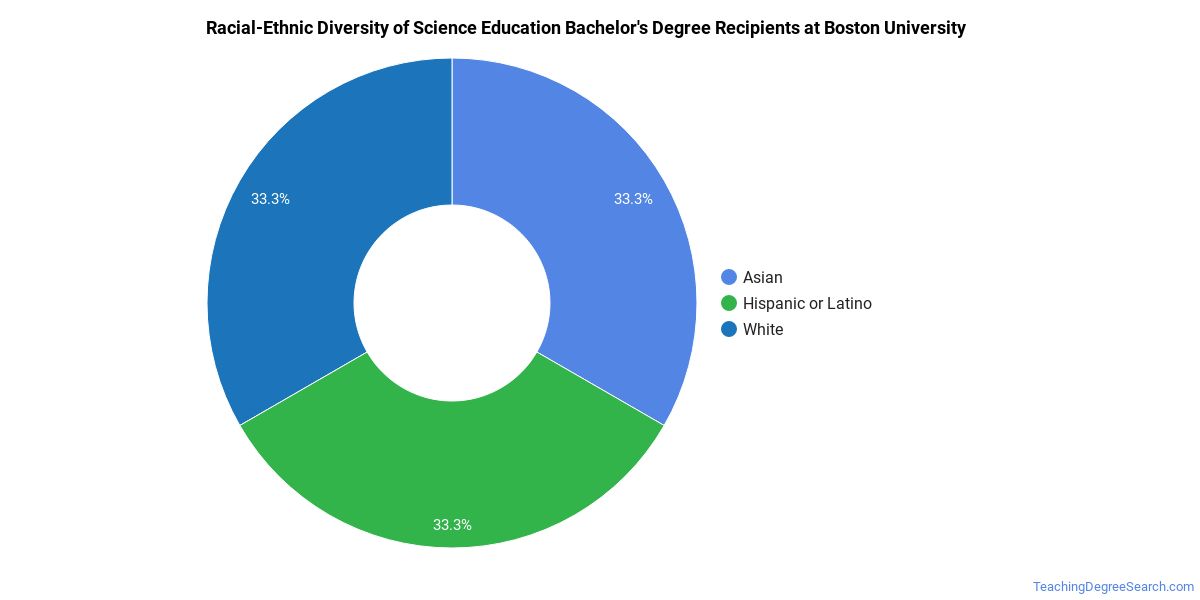
Racial-ethnic minorities make up 50% of Science Education bachelor’s degree recipients at Boston University, higher than the national average of 17%.*
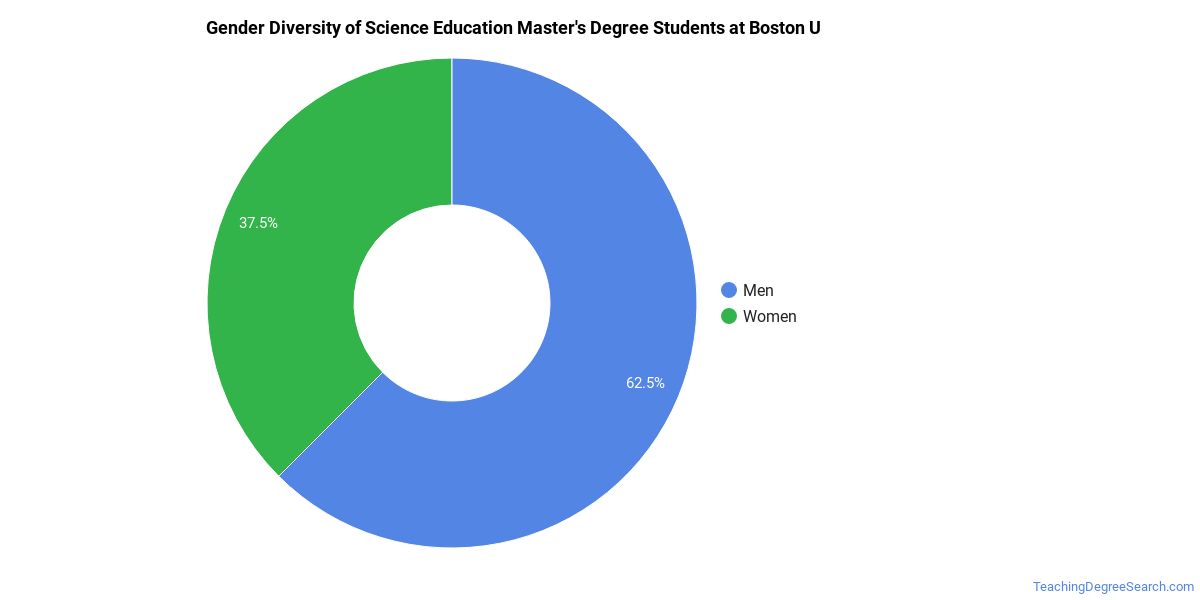
Science Education Master’s Program at Boston University
Among the 10 master’s science education graduates at Boston University, 70% were women (7) and 30% were men (3).
The following table and chart show the race/ethnicity of Science Education master’s degree recipients at Boston University.
| Race / Ethnicity | Number of Graduates |
|---|---|
| White | 4 |
| Hispanic / Latino | 3 |
| Two or More Races | 1 |
| International (Nonresident) | 2 |
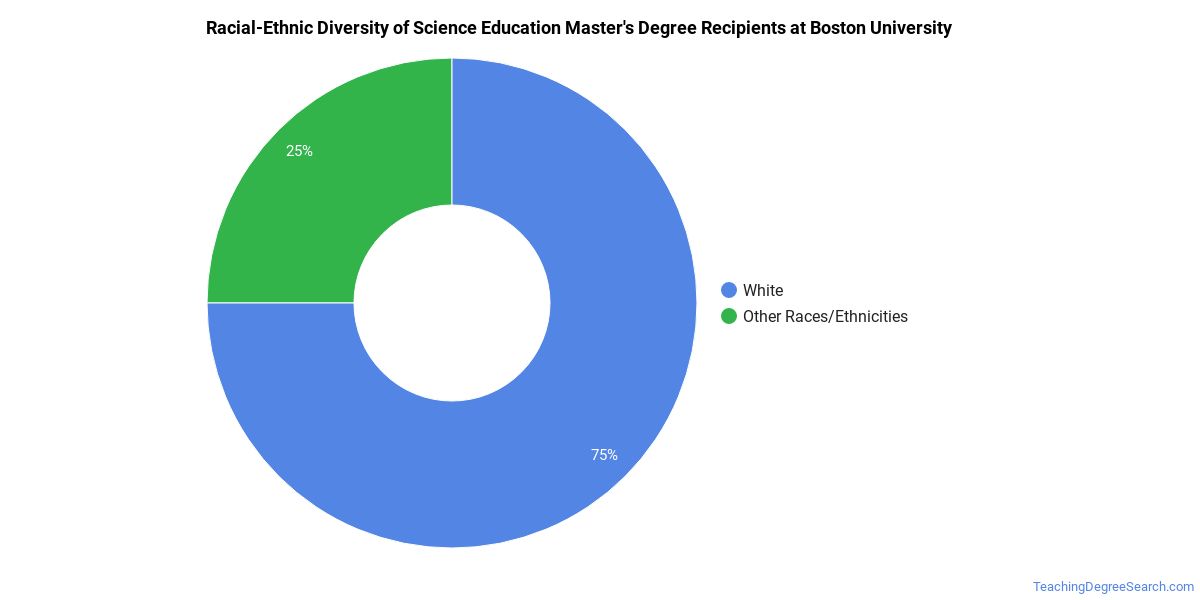
Racial-ethnic minorities make up 40% of Science Education master’s degree recipients at Boston University, above the national average of 26%.*
*The racial-ethnic minorities figure is the total number of graduates minus White, international (nonresident), and unknown-race graduates.
Highest-Paying Careers for Science Education Graduates
Those who complete Science Education program at Boston University go on to a range of careers. Here are the highest-paying careers for Science Education majors, ordered by median annual salary:
References
- IPEDS — Integrated Postsecondary Education Data System
- U.S. Department of Education — College Scorecard
- O*NET Online (Bureau of Labor Statistics)
- National Center for Education Statistics
More about our data sources and methodologies.
TeachingDegreeSearch.com provides higher-education, college and university, degree, program, career, salary, and other helpful information to students, faculty, institutions, and other internet audiences. Presented information and data are subject to change. Inclusion on this website does not imply or represent a direct relationship with the company, school, or brand. Information, though believed correct at time of publication, may not be correct, and no warranty is provided. Contact the schools to verify any information before relying on it. Financial aid may be available for those who qualify. The displayed options may include sponsored or recommended results, not necessarily based on your preferences.
© TeachingDegreeSearch.com – All Rights Reserved.