Teaching for Visually Impaired
A program that focuses on the design of educational services for children or adults with visual disabilities which adversely affect their educational performance and that may prepare individuals to teach such students. Includes instruction in identifying students with visual impairments, developing individual education plans, teaching and supervising blind or visually handicapped students, counseling, and applicable laws and policies.
Featured schools near , edit
Types of Degrees Teaching for Visually Impaired Majors Are Earning
Those studying Teaching for Visually Impaired can earn degrees at several award levels.
| Award Level | Graduates |
|---|---|
| Bachelor’s Degree | 7 |
| Master’s Degree | 154 |
What Teaching for Visually Impaired Majors Need to Know
Studies in Teaching for Visually Impaired develop a specific mix of knowledge, skills, and abilities — derived from O*NET surveys of workers in occupations that Teaching for Visually Impaired graduates commonly enter.
Knowledge Areas
This major prepares you for careers needing Teaching for Visually Impaired emphasizes the following knowledge areas:
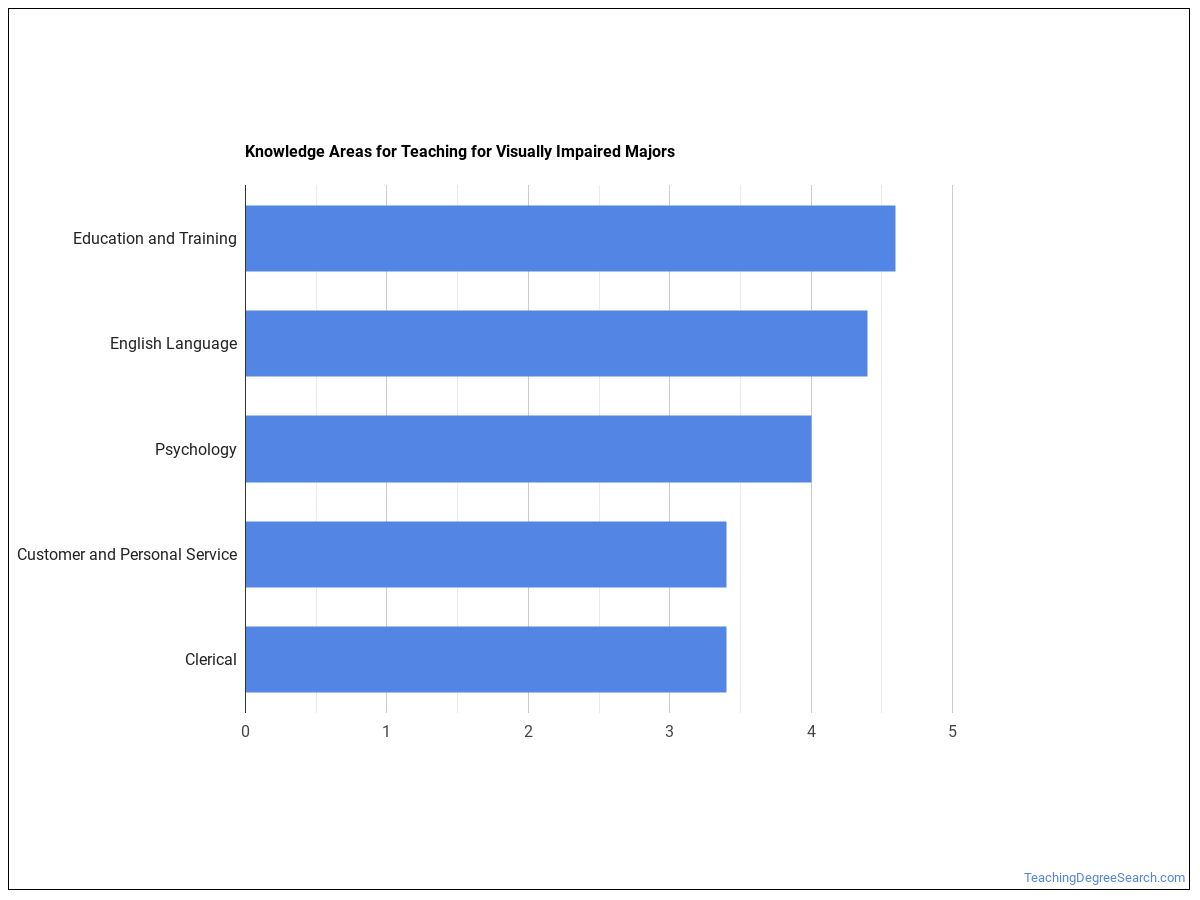
- Education and Training — Importance 4.5 / 5; level 5.5 / 7.
- English Language — Importance 4.3 / 5; level 5.0 / 7.
- Psychology — Importance 3.9 / 5; level 4.5 / 7.
- Customer and Personal Service — Importance 3.4 / 5; level 4.1 / 7.
- Mathematics — Importance 3.2 / 5; level 3.8 / 7.
Importance is rated 1–5; level is 1–7. Source: ONET Online — weighted across related occupations.*
Skills
The skill set built by a Teaching for Visually Impaired program reflects the day-to-day work of related occupations:
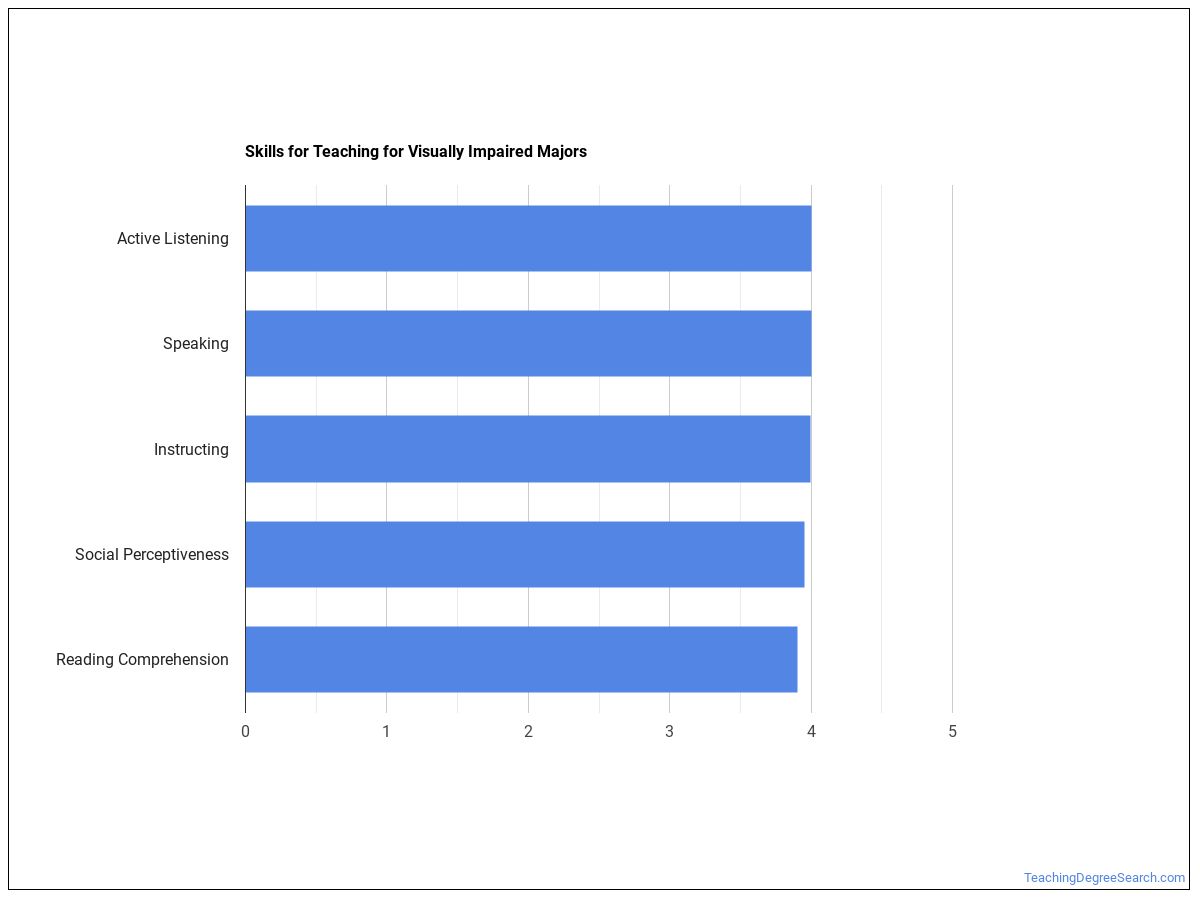
- Speaking — Importance 4.2 / 5; level 4.3 / 7.
- Instructing — Importance 4.0 / 5; level 3.9 / 7.
- Active Listening — Importance 4.0 / 5; level 4.2 / 7.
- Reading Comprehension — Importance 4.0 / 5; level 4.3 / 7.
- Learning Strategies — Importance 4.0 / 5; level 4.3 / 7.
Abilities
Abilities most relevant to Teaching for Visually Impaired careers — again drawn from O*NET surveys of related occupations:
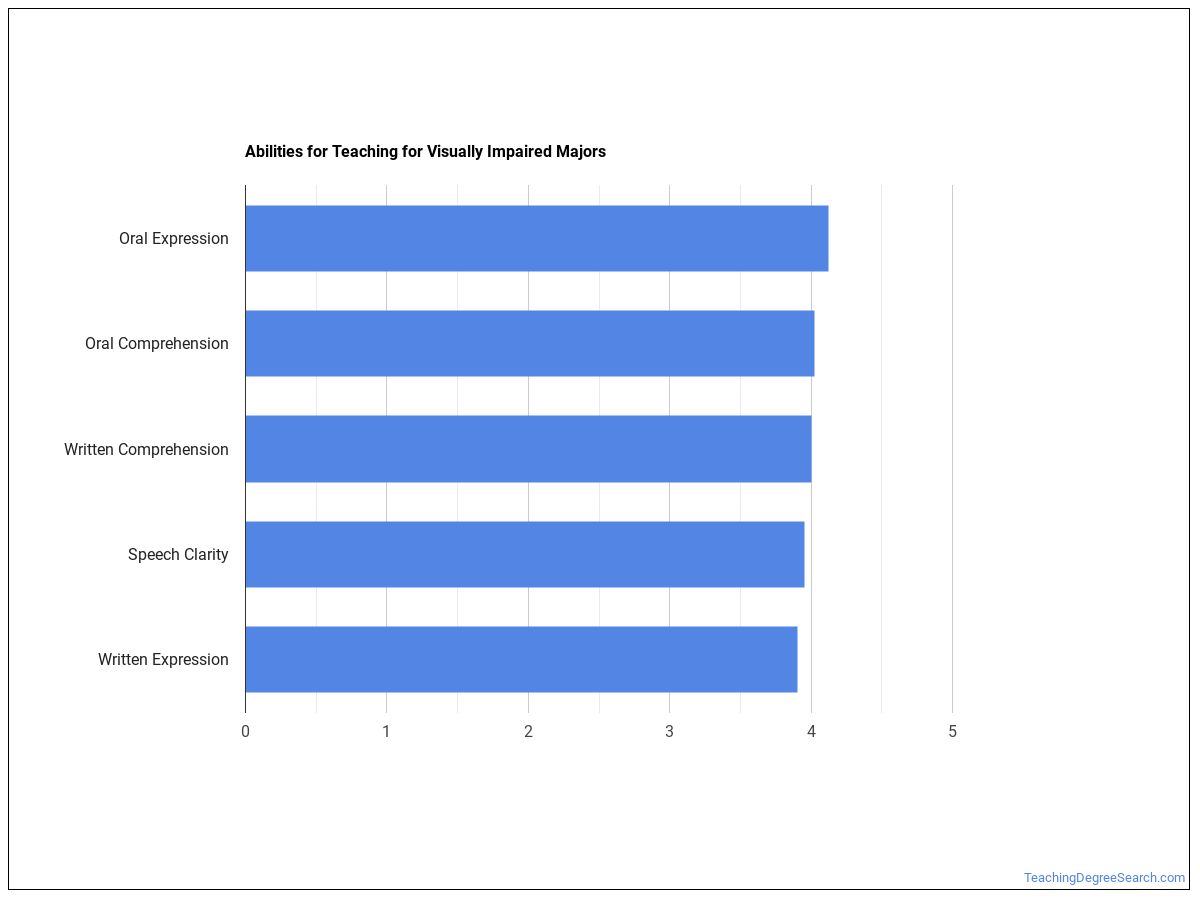
- Oral Expression — Importance 4.2 / 5; level 4.4 / 7.
- Speech Clarity — Importance 4.0 / 5; level 4.3 / 7.
- Oral Comprehension — Importance 4.0 / 5; level 4.4 / 7.
- Written Comprehension — Importance 4.0 / 5; level 4.3 / 7.
- Written Expression — Importance 3.9 / 5; level 4.3 / 7.
Common Job Activities
Day-to-day, Teaching for Visually Impaired graduates report doing:
| Activity | Frequency / Importance |
|---|---|
| Getting Information | 4.3 / 7 |
| Organizing, Planning, and Prioritizing Work | 4.2 / 7 |
| Establishing and Maintaining Interpersonal Relationships | 4.2 / 7 |
| Communicating with Supervisors, Peers, or Subordinates | 4.1 / 7 |
| Training and Teaching Others | 4.1 / 7 |
| Making Decisions and Solving Problems | 4.0 / 7 |
| Working with Computers | 3.9 / 7 |
| Documenting/Recording Information | 3.8 / 7 |
| Coaching and Developing Others | 3.8 / 7 |
| Thinking Creatively | 3.8 / 7 |
Technology Skills Used on the Job
Most frequently-cited tools used by Teaching for Visually Impaired professionals:
| Tool / Software | Category | In-Demand |
|---|---|---|
| Email software | Electronic mail software | — |
| Microsoft Word | Word processing software | — |
| Microsoft Outlook | Electronic mail software | ✓ |
| Web browser software | Internet browser software | — |
| Microsoft Excel | Spreadsheet software | ✓ |
| Microsoft PowerPoint | Presentation software | — |
| Microsoft Office software | Office suite software | — |
| Screen reader software | Device drivers or system software | — |
| Screen magnification software | Device drivers or system software | — |
| Voice activated software | Voice recognition software | — |
| Word processing software | Word processing software | — |
| Blackboard software | Data base user interface and query software | — |
Source: ONET Online technology skills, weighted across related occupations.*
Sample Job Titles
Real job postings for Teaching for Visually Impaired graduates include:
- Physically Impaired Teacher
- Learning Support Teacher
- Lip Reading Teacher
- Sign Language Teacher
- Blind Teacher
- Braille Teacher
- Learning Disabled Teacher
- Special Needs Teacher
- Reading Specialist
- Learning Specialist
- Resource Specialist
- Hearing Impaired Teacher
- Teacher
- Deaf Teacher
- Exceptional Student Education Teacher (ESE Teacher)
What Can You Do With a Teaching for Visually Impaired Degree?
Graduates with a degree in Teaching for Visually Impaired commonly enter the following occupations:
| Occupation | Job Growth | Median Salary | 25th–75th Pctile |
|---|---|---|---|
| Education Teachers, Postsecondary | 2.4% | $98,329 | $80,157–$116,500 |
Job-growth = projected employment change for the parent occupation. Source: ONET / BLS Employment Projections.*
Education Typically Required
Across the occupations open to Teaching for Visually Impaired graduates, the typical level of education actually held by current workers is distributed as:
| Education Level | Share of Workers |
|---|---|
| Bachelor’s degree | 35.2% |
| Doctoral degree | 27.7% |
| Master’s degree | 21.9% |
| Post-baccalaureate certificate | 13.0% |
| First professional degree | 1.0% |
| High school diploma or equivalent | 0.5% |
| Associate’s degree (or other 2-year) | 0.4% |
| Some college courses | 0.2% |
| Post-master’s certificate | 0.1% |
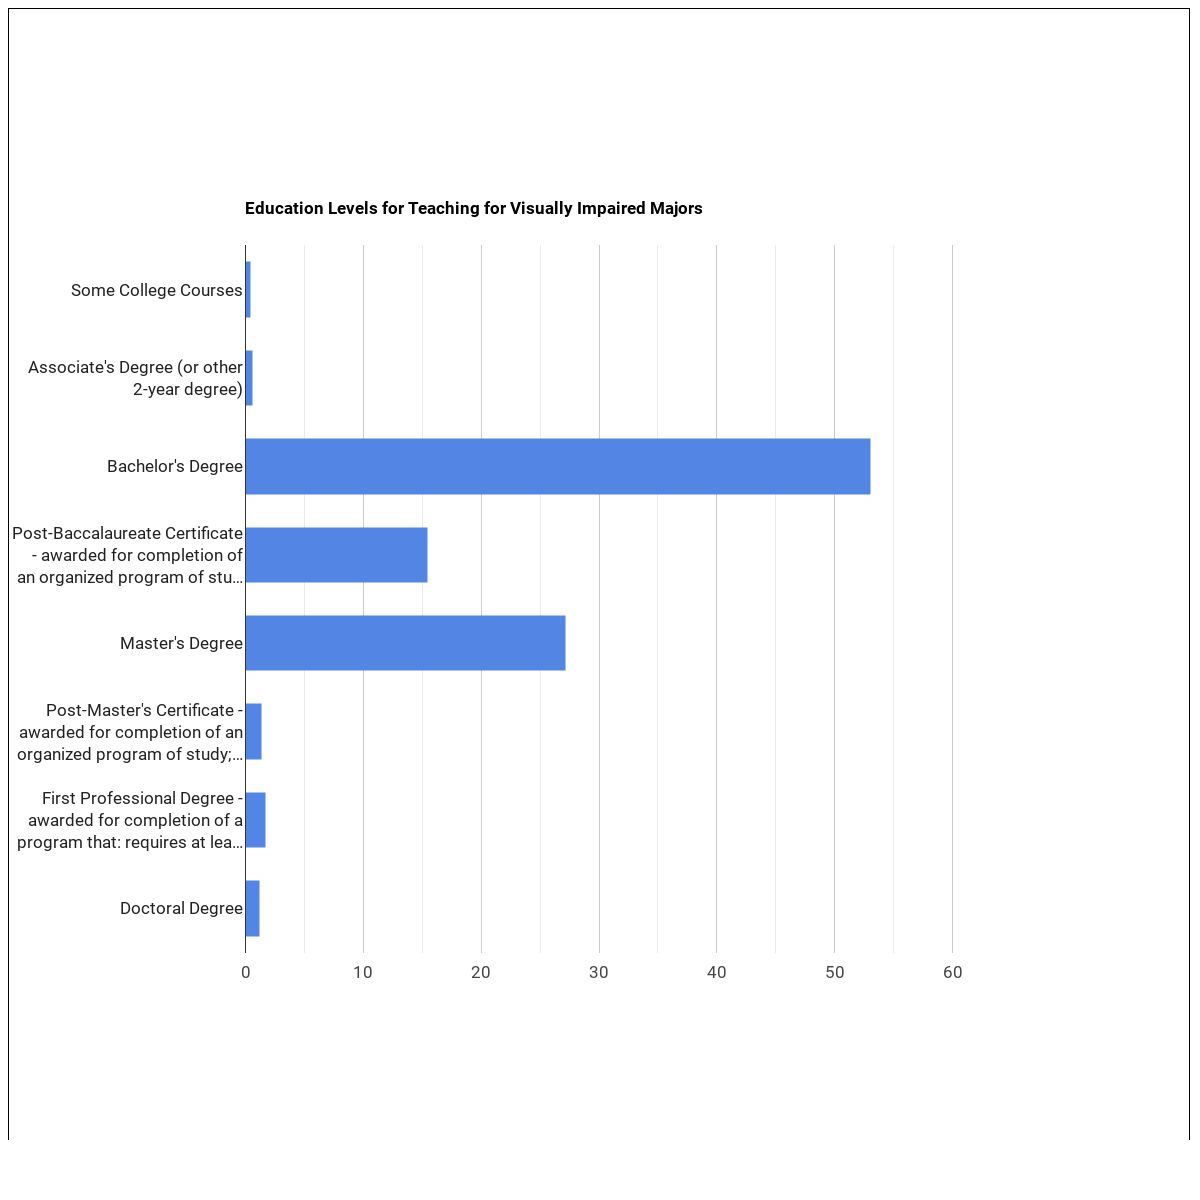
Source: ONET Online education / training / experience requirements.*
Who Is Earning a Degree in Teaching for Visually Impaired?
Gender Distribution
This field skews predominantly female, with women earning 79.5% of Teaching for Visually Impaired degrees.
| Gender | Graduates | Share |
|---|---|---|
| Women | 128 | 79.5% |
| Men | 33 | 20.5% |
Racial-Ethnic Diversity
At the national level, the racial-ethnic distribution of Teaching for Visually Impaired graduates is as follows:
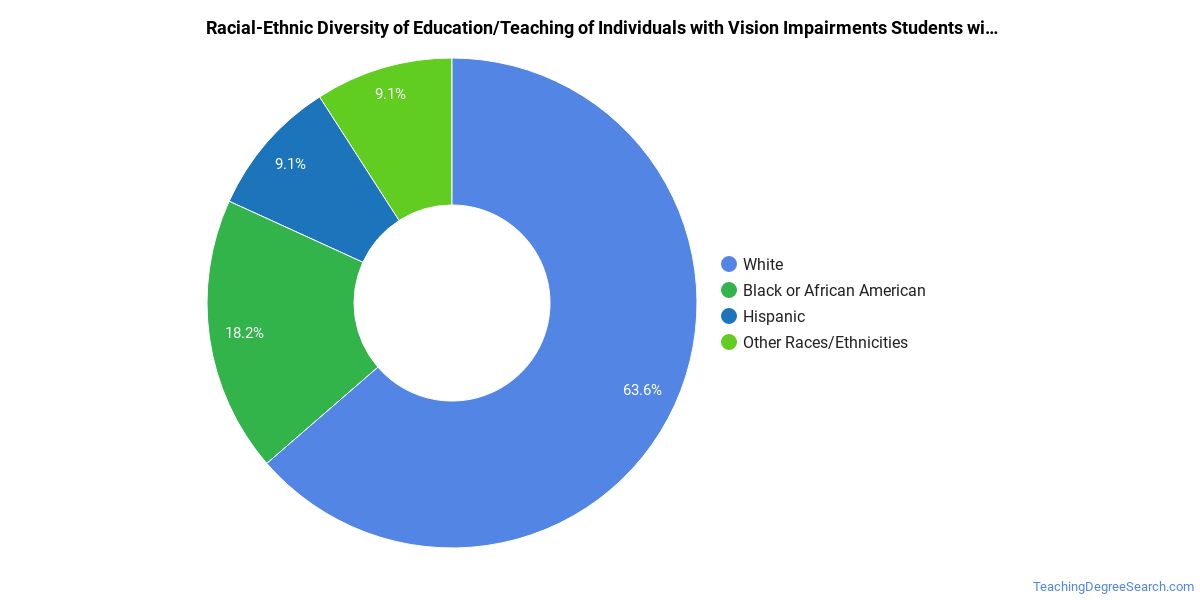
| Race / Ethnicity | Graduates | Share |
|---|---|---|
| White | 121 | 75.2% |
| Asian | 4 | 2.5% |
| Hispanic or Latino | 14 | 8.7% |
| Black or African American | 14 | 8.7% |
| Two or More Races | 3 | 1.9% |
| Race Unknown | 4 | 2.5% |
| International Students | 1 | 0.6% |
See minority definition below.
How Much Do Teaching for Visually Impaired Graduates Earn?
The U.S. Department of Education tracks median earnings of Teaching for Visually Impaired graduates 1, 4, and 5 years after completion. These numbers tend to grow steadily as graduates gain experience and move into mid-career roles.
| Years Out | Median Earnings |
|---|---|
| 1 year | $54,981 |
| 4 years | $54,220 |
| 5 years | $59,983 |
By year 5 out, median earnings rise to $59,983 — roughly 9% above the 1-year mark.
Source: U.S. Department of Education College Scorecard, field-of-study earnings tracker.
Online Teaching for Visually Impaired Programs
Fully online options are documented by IPEDS for Teaching for Visually Impaired. The table below shows how many graduates earned at least some of their coursework online (Distance-Ed Available) versus completing the entire program online (Distance-Ed Only).
| Award Level | Distance-Ed Available | Distance-Ed Only |
|---|---|---|
| Master’s | 4 | 0 |
Distance-Ed Only = degrees completed entirely online; Distance-Ed Available = degrees including at least some online coursework. Source: IPEDS Completions by Distance Education status.
Is a Degree in Teaching for Visually Impaired Worth It?
Looking purely at the federal earnings tracker, Teaching for Visually Impaired graduates earn a median of $54,220 four years after completion — roughly 43% above the national median for workers with only a high school diploma (~$38,000).
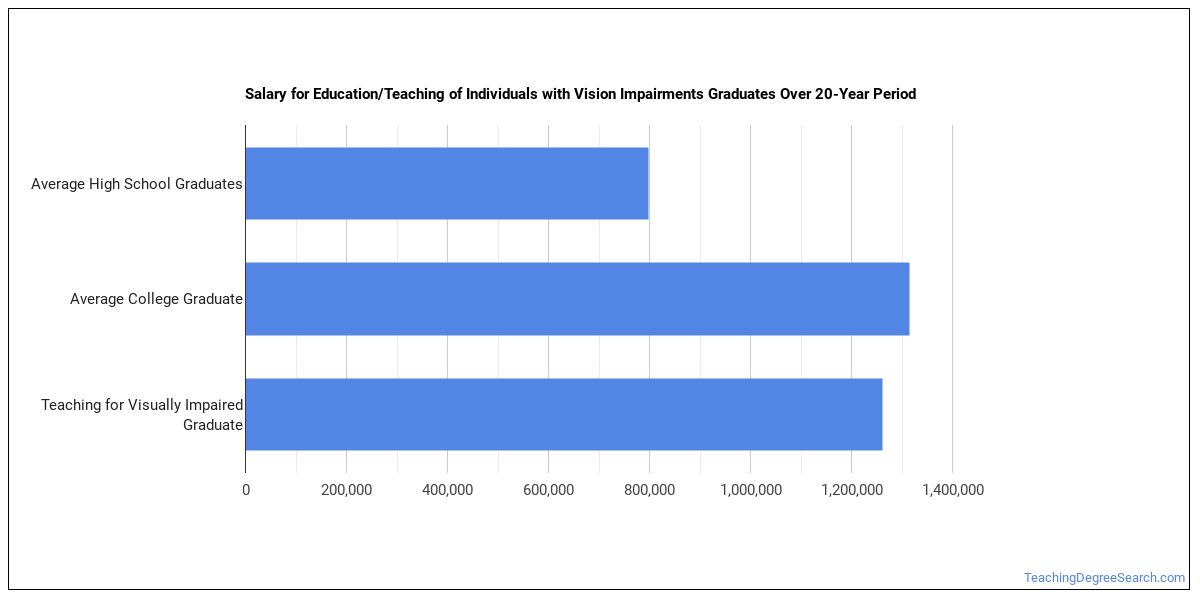
ROI estimate compares the program’s 4-yr median earnings against the 2023 BLS CPS median earnings for high-school-only workers. Source: U.S. Department of Education College Scorecard + BLS Current Population Survey.
Related Programs
You may also be interested in these closely related fields of study:
Explore Teaching for Visually Impaired by State
Alabama
California
District of Columbia
Idaho
Kansas
Maryland
Mississippi
Nevada
New York
Oklahoma
South Carolina
Utah
West Virginia
Alaska
Colorado
Florida
Illinois
Kentucky
Massachusetts
Missouri
New Hampshire
North Carolina
Oregon
South Dakota
Vermont
Wisconsin
References
The racial-ethnic minorities count is calculated by taking the total number of students and subtracting white students and international students. This number is then divided by the total number of students to obtain the racial-ethnic minorities percentage.
- College Factual
- National Center for Education Statistics (IPEDS)
- O*NET Online
- U.S. Bureau of Labor Statistics
- U.S. Department of Education College Scorecard
More about our data sources and methodologies.
TeachingDegreeSearch.com provides higher-education, college and university, degree, program, career, salary, and other helpful information to students, faculty, institutions, and other internet audiences. Presented information and data are subject to change. Inclusion on this website does not imply or represent a direct relationship with the company, school, or brand. Information, though believed correct at time of publication, may not be correct, and no warranty is provided. Contact the schools to verify any information before relying on it. Financial aid may be available for those who qualify. The displayed options may include sponsored or recommended results, not necessarily based on your preferences.
© TeachingDegreeSearch.com – All Rights Reserved.